"Aircraft are now capable of flying in icing clouds without difficulty, however, because research by the NACA and others has provided the engineering basis for icing protection systems"
"THE ICING PROBLEM - CURRENT STATUS NACA TECHNIQUES AND RESEARCH" 1
Abstract
This paper summarizes some of the techniques used in N.A.C.A. research programs, in flight and in tunnels, to solve aircraft icing problems and it indicates the scope of the data available for the design of aircraft icing protection systems. Sufficient data have been obtained, generalized where possible, and techniques have been established whereby icing-protection requirements for most aircraft components can be determined sufficiently accurately for engineering purposes. The Appendices discuss the icing facilities at the N.A.C.A. Lewis laboratory in detail, specific test equipment and techniques used in conducting tests in icing wind tunnels, and several icing instruments.
Introduction
This is an excellent summary by Uwe von Glahn of the "state of the art" in 1955, and also summarizes many of the NACA achievements in aircraft icing (there were more after 1955.)
It is also a good introduction, although rather technical (but with no math) to aircraft icing, that has held up well for more than 6 decades.
Unfortunately, an online reprint 2, was an almost illegible reproduction, and that might have been how many current readers first encountered it. Readers can now get the best available copy at ntrs.nasa.gov.
Here, it will be presented in its entirety. A few of the figures are not very clear, and clearer versions are included, where applicable.
Not included herein is the "Selected Bibliography of NACA-NASA Aircraft Icing Publications", which was first presented in 1969, and is appended after the reprinted "The Icing Problem" in NASA-TM-81651 1.
I have not been able to find other presentations from the "Ottawa AGARD Conference. AG 19/P9, June 10-17 1955".
As this is a longer than usual blog post, navigation by sections is provided below.
Sections available are:
"The Icing Problem" original text
Appendix A - Icing Tunnel Facilities
Appendix B - Operational Techniques
Appendix C - Icing Instruments
References
For legibility, the usual convention of block quotes will be reversed below. The original is plain text, and comments or additions are in block quote format.
Block quote format example.
"The Icing Problem" original text
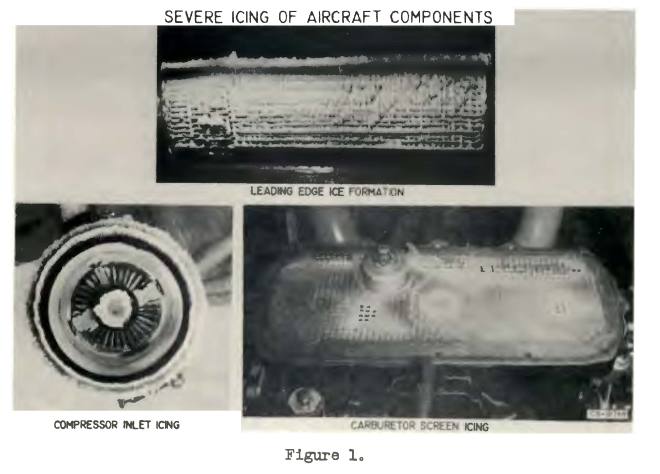
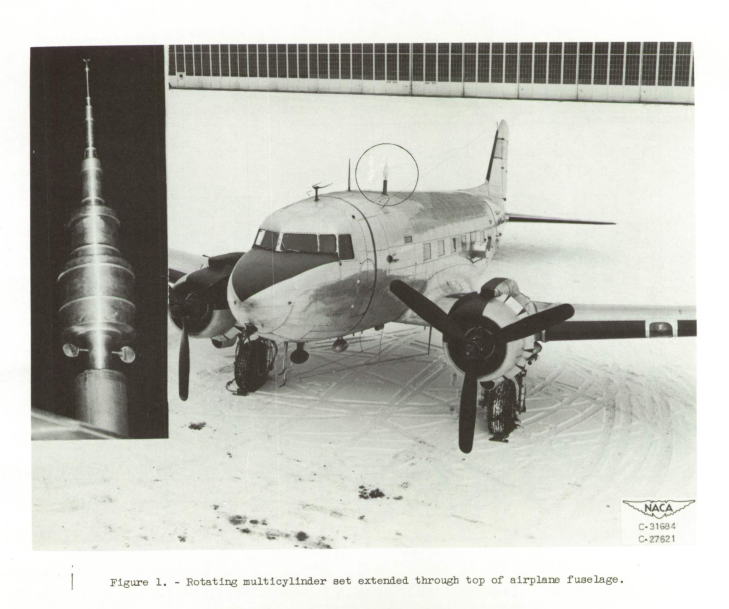
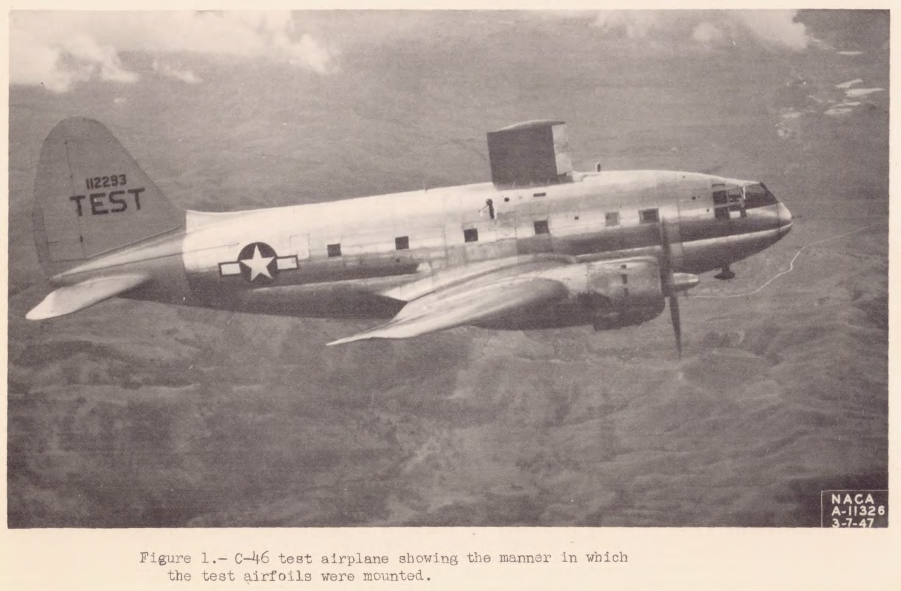
Icing of aircraft components such as airfoil surfaces and engine-inlet systems similar to those shown in figure 1 creates a serious operational problem. Aircraft are now capable of flying in icing clouds without difficulty, however, because research by the NACA and others has provided the engineering basis for icing protection systems. This paper summarises some of the techniques used in NACA programs to solve aircraft icing problems and indicates the scope of the data available for the design of aircraft icing protection systems. In addition, appendixes A to C discuss the NACA Lewis icing facilities in detail, specific test equipment and techniques used in conducting tests in icing wind tunnels, and several icing instruments.
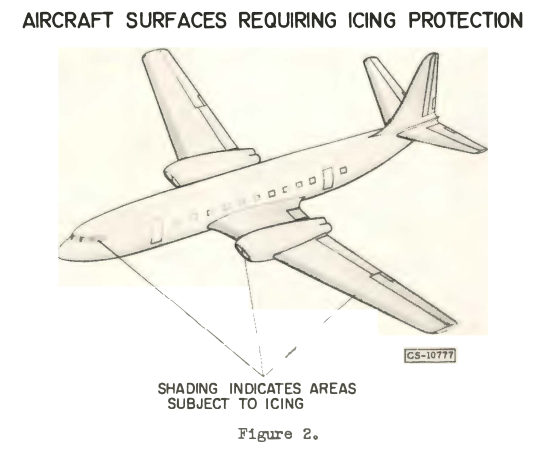
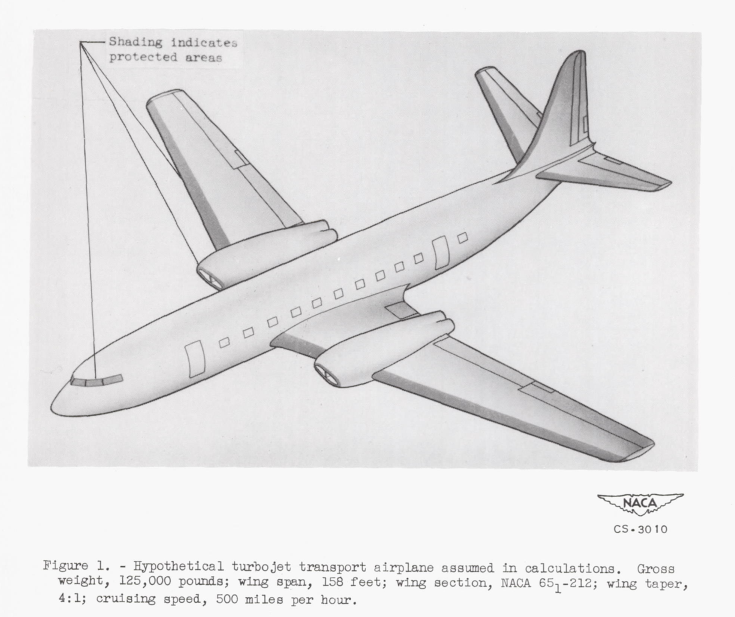
Icing of aircraft surfaces occurs when liquid cloud droplets cooled below the freezing temperature impinge on a surface that is also below freezing. All surfaces that are exposed to the direct impingement of super-cooled water droplets therefore may require icing protection (fig. 2). The size and extent of icing on an airplane component is a function of cloud liquid-water content, droplet size, and air temperature, physical dimensions and shape of the component (size, shape, and attitude), and operating conditions (airspeed and altitude).
A clearer version of the figure is from NACA-TN-2866:
A body moving through a cloud of water droplets, in general. will not intercept all the droplets originally contained in the volume of air swept out by the projected frontal area of the body (fig. 3).
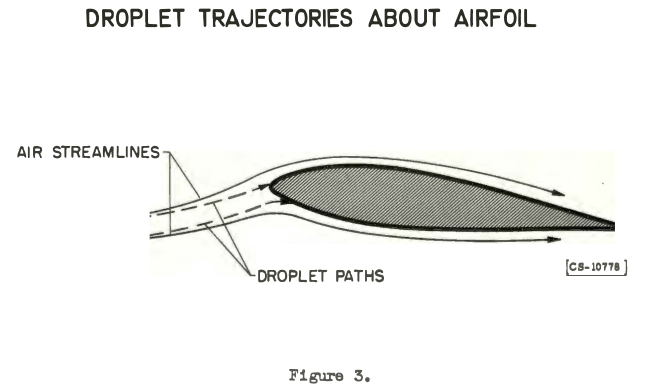
As the droplets reach the vicinity of the body, the air streamlines flow around the body. The droplets, because of their momentum, tend to maintain straight paths toward the body; however, a drag force imposed by the relative velocity of the air with respect to a droplet tends to cause the droplet to follow the air streamlines. The relative magnitudes of the momentum and drag forces determine the droplet path. The path of droplets in the flow field can be determined analytically with particle trajectory equations. In order to do this, however, the size of the cloud droplets must be known. This information has been obtained with instrumented aircraft in flight through icing clouds. Two of the most widely used meth~ds of obtaining cloud icing data are rotating multicylinders and the pressure-type icing-rate meter. The rotating-multicylinder method has been used extensively to collect data on both droplet-size distribution and liquid-water content in super-cooled clouds (refs. 1 to 4).
The collection of ice by the cylinders is similar to the collection of ice by airplane components. Therefore the data obtained by this method have been valuable in designing icing protection systems for airplanes. In this method, several cylinders of different diameter rotating on a common axis are exposed from an aircraft in flight or in an icing tunnel to supercooled cloud droplets as shown in figure 4.
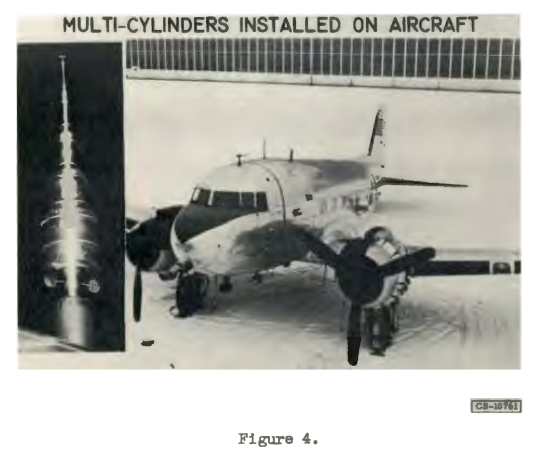
A clearer version of the figure is from NACA-RM-E53D23:
During the exposure period, the cylinders collect ice. The cylinders are rotated in order to obtain uniform ice collection around the circumference and thereby to preserve a circular cross section.
After exposure, the diameters ot the iced cylinders are measured and the iced cylinders are weighed. The measurement of droplet size and water content is based on the principle that cylinders of different sizes collect different quantities of ice per unit frontal area. The ice collection of each cylinder is expressed in terms of a collection efficiency that has been obtained theoretically. The liquid water content, average droplet size, nnd droplet-size distribution are obtained by a comparison of the measured weight of ice collected on each cylinder with calculated values of collection efficiency. The method is applicable only in clouds where the temperature is below 0° C.
The pressure-type instrument (ref. 5) operates on the differential pressure created when small total pressure holes plug with ice accretions, as illustrated in the sketch of figure 5.
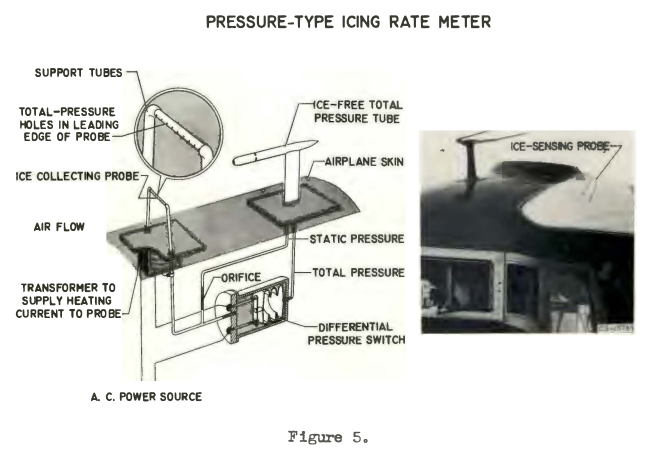
A clearer version of part of the figure is from NACA-RM-E51E16:
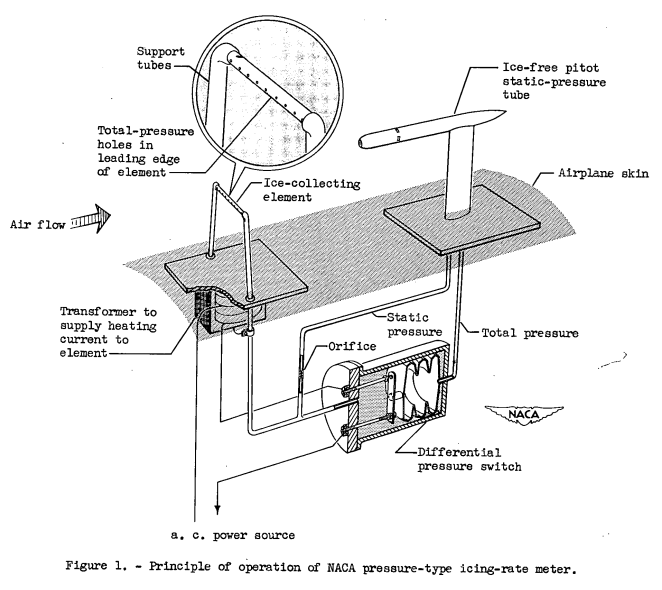
The small total-pressure holes in the ice-collecting element, which are vented to static pressure through a small orifice. are balanced against a nun-vented, ice-free total pressure in a differential pressure switch. When these small total-pressure holes plug from ice accretion, the pressure in the corresponding side of the pressure switch approaches static by bleeding through the static orifice, and a differential pressure is erected between the iced and ice-free systems. Continuous operation is obtained by allowing the differential pressure switch to energize an electrical heater that de-ices the ice-plugged total-pressure holes. The pressures in the two systems then tend to equalize, opening the pressure switch and allowing the cycle to be repeated. The heat-off time of this cyclic process is used as a measure of the period of time required to plug the holes. This period of time is a function of the rate at which ice accumulates on the element containing the holes, because the amount of ice accretion required for plugging is a constant value. The duration of the heat-off period is calibrated against a measured icing rate. An NACA flight-type film recorder is used to record continuously the duration of the heat-off or icing period, the heat-on or de-icing period, the indicated air- speed1 the air temperature and the altitude. The icing rate is then used to calculate the water content of the icing cloud. This instrument is limited by water run-off at air temperatures near 0° C and high water contents, as are the rotating multi-cylinders. Also, it does not measure droplet size. Other icing instruments are discussed in appendix c.
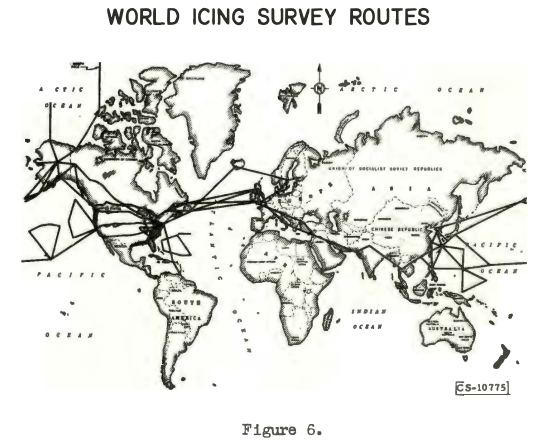
In general, the average droplet size in icing clouds is in the range of 10 to 25 microns in diameter. In stratus clouds the maximum water content is about 1.5 grams per cubic meter, while in cumulus clouds the water content may be as high as 3.5 grams per cubic meter. Fortunately, these high water contents extend over only a short horizontal distance. For cumulus clouds the extent of such high water contents is only about 1/2 mile, while for stratus clouds the high water contents usually do not exceed 10 to 20 miles. The data obtained by the rotating-multicylinder method have been of significance in establishing meteorological design criteria for aircraft icing protection systems. These data, however, were based on flights by only a few aircraft in deliberately sought icing conditions. The data from the pressure-type meter have been obtained on a routine flight basis by a cooperative program between the NACA, commercial airlines, and the United States Air Force. Some 50 aircraft were instrumented with these meters in various geographical areas of the world (fig. 6), including the North Atlantic, the continental United States, Alaska, the Pacific, and Japan. In addition, the program has been supplemented by in-flight weather reconnaissance reports from the Air Weather Service and Strategic Air Command aircraft over a two-year period.
These data have been put on punch cards and are currently being analyzed on IBM equipment. Because most of the data obtained from routine flights apply to low altitudes, special efforts are being made to obtain data on the occurrence of icing at altitudes above 20,000 feet. Data obtained to date show that icing is rarely encountered about 30,000 feet because of the infrequency of clouds containing liquid water at the low temperatures associated with these altitudes. In addition, the severity of icing encountered above 30,000 feet is usually low except in scattered thunderstorm clouds.
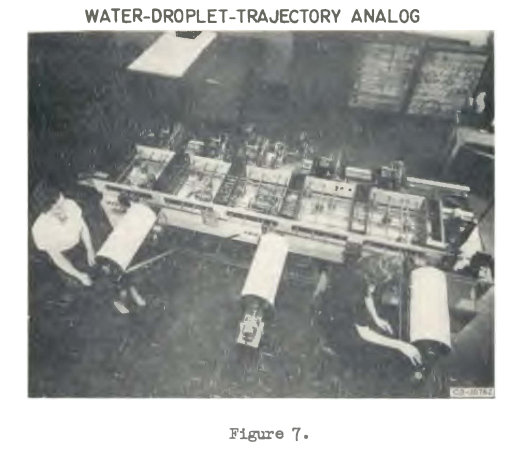
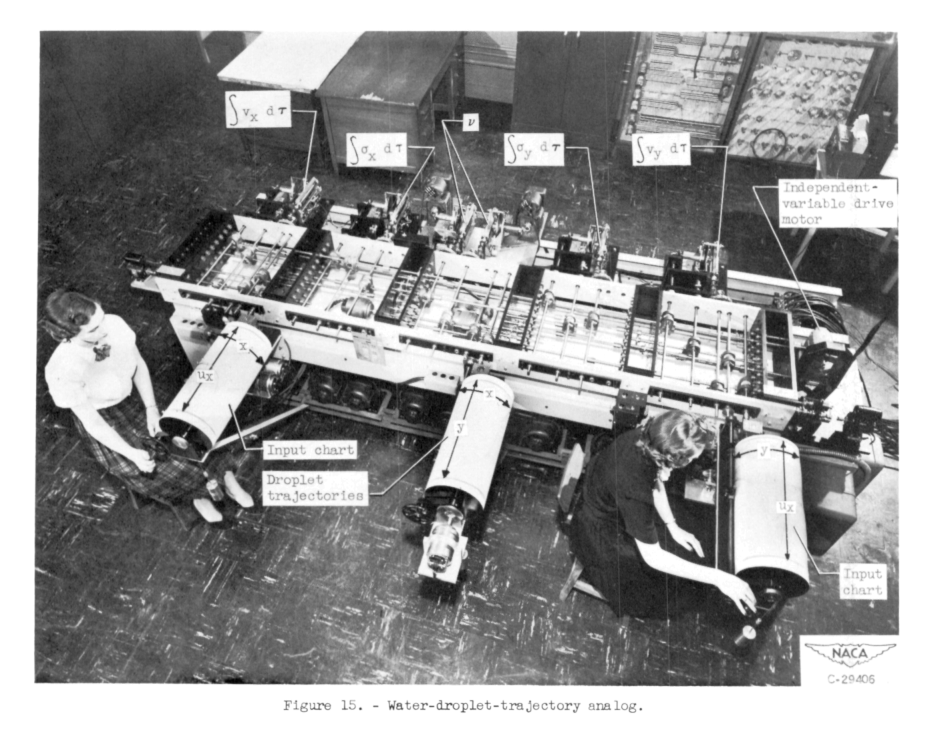
The impingement characteristics and the initial rate of ice formation on aircraft components can be obtained by either theoretical trajectory studies or experimental means, once the water content and droplet sizes of icing clouds are available. Most of the NACA analytical studies of droplet trajectories about various bodies (refs. 6 to 13) utilize a differential analyzer (fig. 7), since experience has shown that even the simplest manual calculations are time-consuming and inaccurate. The use of the differential analyzer in this work is described in reference 14.
A clearer version of the figure from NACA-TN-2904:
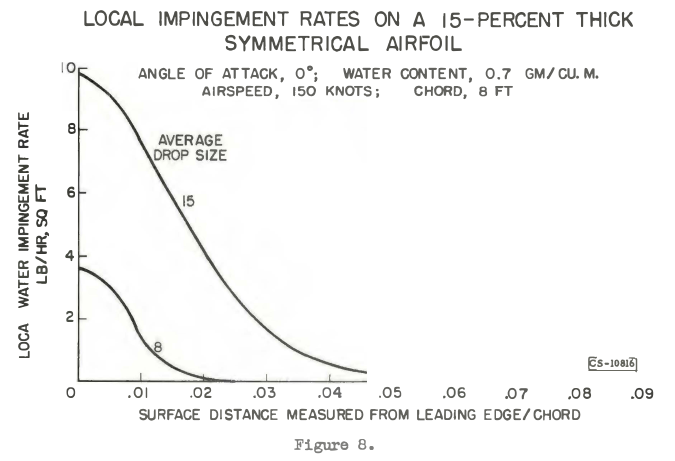
Typical results obtained from such a trajectory study are shown in figure 8, in which the local impingement rate on an airfoil is plotted as a function of surface distance from the leading edge. The data shown are for a 15 percent symmetrical airfoil of 8-foot chord, angle of attack of zero, airspeed of 150 knots, and average droplet sizes of 8 and 15 microns. The greatest impingement occurs at thP stagnation region and decreases rapidly with surface distance from the leading edge. An increase in average droplet size from 8 to 15 microns increases the local impingement rates and causes the impingement area to extend farther aft than with the smaller droplets.
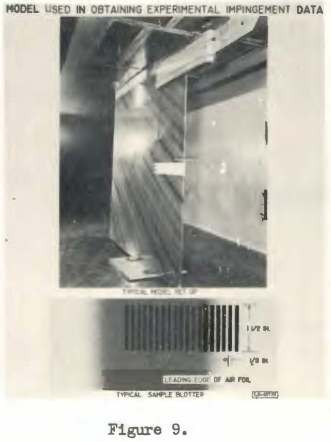
The differential analyzer is difficult to use for droplet trajectories about bodies with complex air flows. Therefore, a wind-tunnel method using a dye-tracer technique (ref. 15) is often used to obtain experimentally the droplet impingement on these bodies. In this technique (fig. 9), water treated with known small quantities of water-soluble dye ia sprayed into the airstream a large distance ahead of the body by nozzles. The surface of the body is covered with blotter paper upon which the dyed water droplets impinge and are absorbed. At the point of droplet impact, a permanent dye trace is obtained. The amount of dye obtained in a measured time interval can be determined by a colorimetric analysis of punched-out segments of blotted paper (fig. 9) and converted into the quantity of water that produced the dye trace. The maximum extent of impingement of the local dye or water deposit over the entire wetted surface will yield the total amount of water collected by the body. !hie experimental technique requires a knowledge of the droplet-size distribution and water content of the spray cloud. Methods of obtaining these parameters have been worked out and are included in the report concerning the technique (ref. 15).
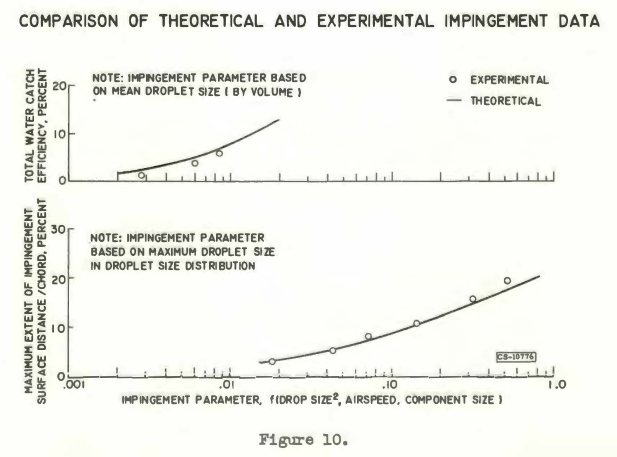
The total water catch and the extent of impingement on an airfoil surface obtained by the differential analyzer are compared in figure 10 with the experimental data (unpublished). These data are shown as a function of an impingement parameter which. in this case, depends primarily on the droplet size squared, wing chord, and airspeed (ref. 16). These are typical results for a 15 percent-thick symmetrical wing at zero angle of attack.
From a knowledge of the droplet impingement characteristics and meteorological parameters, the local water impingement rate or icing rate on component surfaces can be calculated. Unfortunately, the shape of the resultant ice formation, which has a large effect on the aerodynamic penalties associated with component icing, can only be estimated based on limited experimental data, since the ice-formation shape is also a function of airfoil sweep angle, air temperature, and aircraft speed. Ice shapes can be generalized into two primary shapes, rime icing and heavy glaze icing (fig. 11).
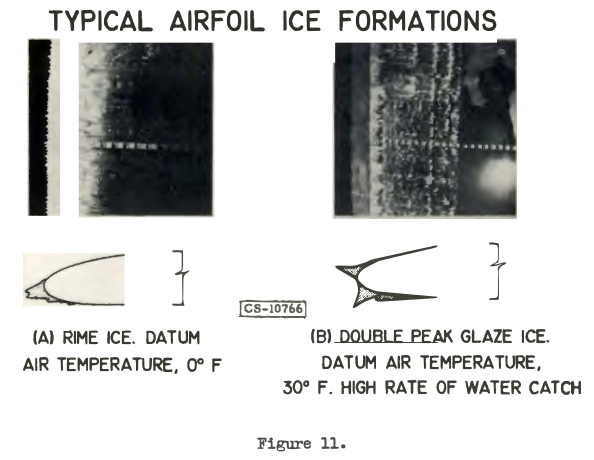
Rime icing is associated primarily with low air temperatures and results in relatively streamlined ice formations that blend into the body shape and cause little aerodynamic penalty. Heavy glaze icing results £rom high water contents, large droplets, and surface temperatures near freezing. This combination of meteorological conditions causes rough ice formations that protrude from the body surfaces into the airstream and cause large aerodynamic penalties.
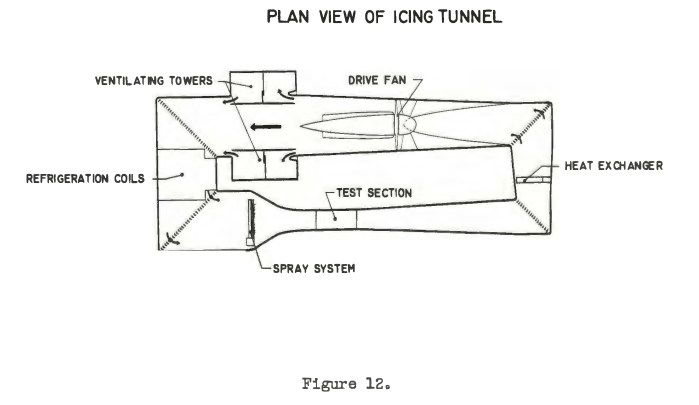
Early attempts to measure these penalties were made in flight through icing clouds. However, the general advantages of doing icing research in a tunnel where conditions can be controlled were recognized, and an icing research tunnel was built at the NACA Lewis laboratory. The Lewis icing tunnel is a single-return closed-throat tunnel, the general arrangement of which is shown in figure 12. The test section is rectangular in shape, 9 feet wide, 6 feet high, and 20 feet long. The maximum tunnel airspeed with icing condition and with a large model in the test section is about 260 knots. Air temperatures a1 low as -40° C can be obtained, although most tests are conducted in the range of -3 to -20° C.
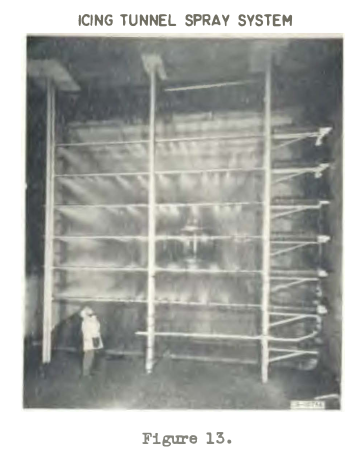
Icing conditions similar to those encountered in the atmosphere are created by a battery of air-water atomizing nozzle. A view of the spray system looking downstream into the test section is shown in figure 13. The spray nozzles are mounted in six horizontal spray bars and located to give a uniform cloud approximately 4- by 4-feet in the test section. This cloud conforms to natural icing clouds measured in flight. Details of this icing tunnel, its equipment and instrumentation, as well as of several high-speed icing duct tunnels, are given in appendixes A and B.
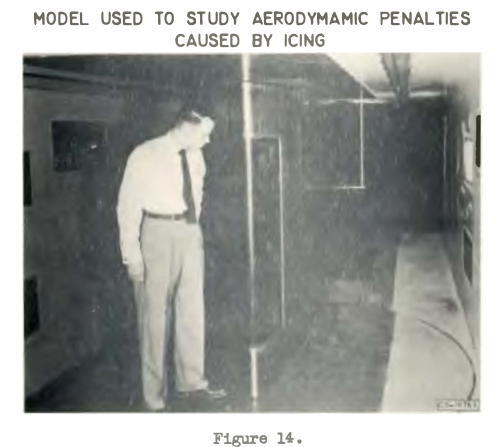
In order to determine the magnitude of the aerodynamic penalties associated with icing of lifting surfaces, airfoils of different sizes, thicknesses, and shapes were tested in the Lewis icing tunnel over a wide range of angles of attack and icing conditions (refs. 17 and 18). Section-drag measurements during icing were obtained by means of an integrating wake survey rake (fig. 14) and the tunnel force-measuring balance system. Lift and pitching moments were also measured with the balance system.
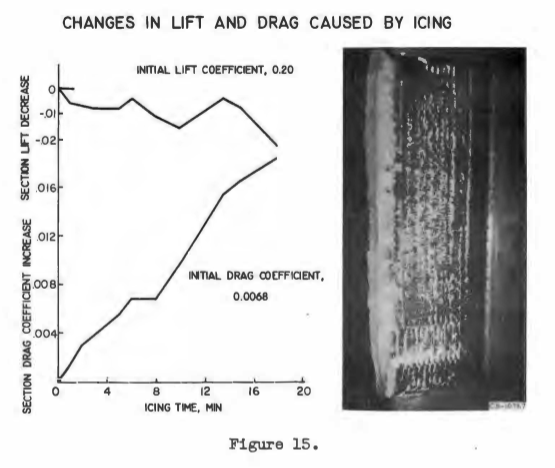
A typical lift and drag curve for an NACA 0011 airfoil at an angle of attack of 2.3° is shown in figure 15 as a function of time in glaze icing, together with a picture of that ice formation at the end of 18 minutes of icing (unpublished data). It is apparent that under these operating conditions the loss in lift of 12 percent and the increase in section drag of 270 percent after 18 minutes of icing could constitute a serious problem for an aircraft.
Ice formations on aircraft components can be prevented by flowing or spraying temperature-depressant fluids over the component surfaces (ref. 19) or by heating the surfaces (refs. 18 to 23). The work of the NACA has emphasized the use of heat for icing protection. Component icing can be prevented by thermal means in two ways: (1) The surfaces can be raised to a temperature just sufficient to maintain the impinging water in a liquid state over the entire surface, or (2) the surfaces can be supplied sufficient heat to evaporate the impinging water in a specified distance aft of the impingement area while the remainder of the surface is unheated. Obviously, it takes more heat per unit surface area to evaporate the water than to maintain the same surface just above 0° C. Calculations show, however (ref. 23), that the total area that requires heating must also be considered in evaluating the total heat requirement. Therefore, the size of the component will generally influence which of the two methods of ice prevention is used.
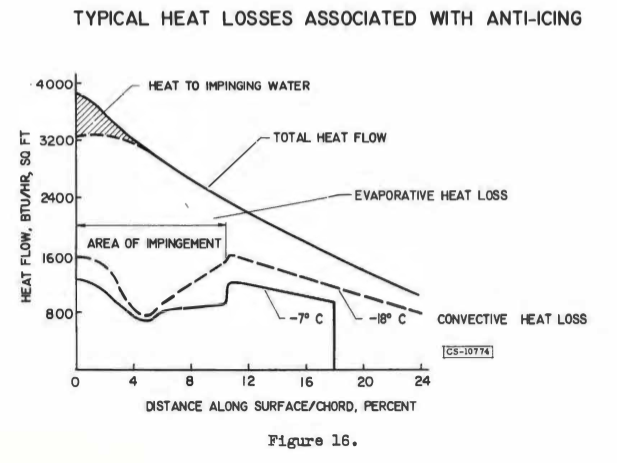
The heat supplied to a component fot icing protection (fig. 16) warms the impinging water to the component surface temperature and evaporates part or all of the impinging water. Some heat is lost to the ambient air by convection. The relative magnitude of the external heat losses shown in figure 16 are typical for anti-icing a wing surface and are shown as a function of surface distance aft of an airfoil leading edge. In addition, some of the heat is lost to adjacent structure by conduction. The external heat-transfer processes from a heated, wetted surface were postulated by J. K. Hardy (refs. 24 and 25).
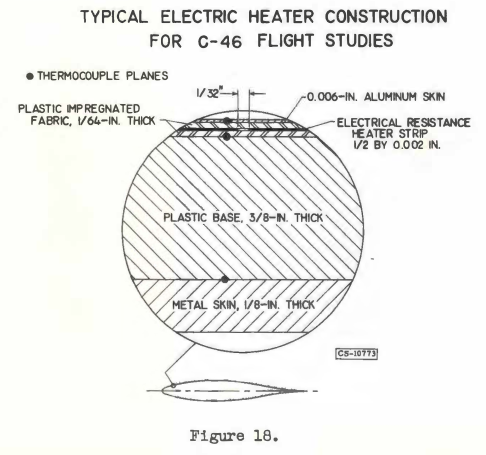
The processes were substantiated by in-flight data obtained by the staff of the NACA Ames laboratory (ref. 20). The Ames tests employed an aircraft with electrically heated dorsal wings (fig. 17). The electrically heated airfoils were instrumented with thermocouples (fig. 18) that, with the conductivity and thickness of the material known, the internal heat loss could be calculated. Because of the thin outer skin, the chordwise heat conduction was considered negligible. Hence, the external local heat transfer was obtained from the total power input and the internal heat loss.
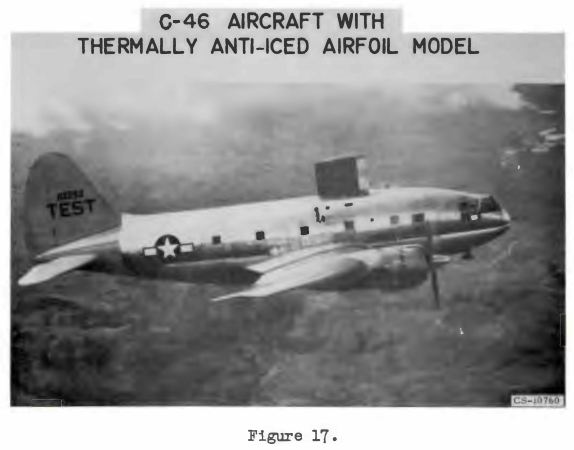
A clearer version of the figure is from "NACA Conference on Aircraft Ice Prevention A Compilation of Papers Presented by NACA Staff Members" 6505/NACA-1947/8, 1947:
Typical results obtained from these studies are shown in figure 16. These data show that the heat for evaporating the impinging water and that lost to the ambient air by convection are approximately equal. The heat required to raise the impinging water to the surface temperature is only a small fraction of the total heat input. At the leading edge the heat flow is about 3900 Btu/(hr)(sq ft), while aft of the impingement area the local heat flow is 2400 Btu/(hr)(sq ft) or less.
In order to demonstrate that the results obtained in icing conditions in the tunnel were the same as those obtained in flight, a wing section carried on the C-46 aircraft during the Ames laboratory flight tests was also tested in the icing tunnel, and the data were compared (ref. 21). The results showed that in similar icing conditions, as determined by measurements of the cloud conditions by similar instruments, the data agreed satisfactorily.
For high-speed, high-altitude aircraft, the icing-protection heat requirements (due to changes in heat transfer and evaporation considerations influenced by speed and altitude) of a thermal anti-icing system are excessive. For example, calculations showed that the heat required for evaporating all the water impinging on a jet powered transport exceeds 7,000,000 Btu/hr. Since this heat would be taken from the jet engines, a severe performance penalty would result (ref. 23).
In order to reduce the thermal requirements for airframe components, cyclic de-icing systems were studied. In cyclic de-icing, ice is permitted to form on the airplane surfaces and is then removed periodically by a short intense application of heat. During the heating period, the bond between the surface and the ice is melted and the ice is removed by aerodynamic forces. Only a few components or sections of a component are heated at a time, the rest being allowed to ice. Because the components are heated successively, proper grouping of the components permits shifting of heat from one group to another and thereby maintaining a constant heat load. The icing or heat off time is determined by the amount of ice that can be tolerated on a component without seriously affecting its performance.
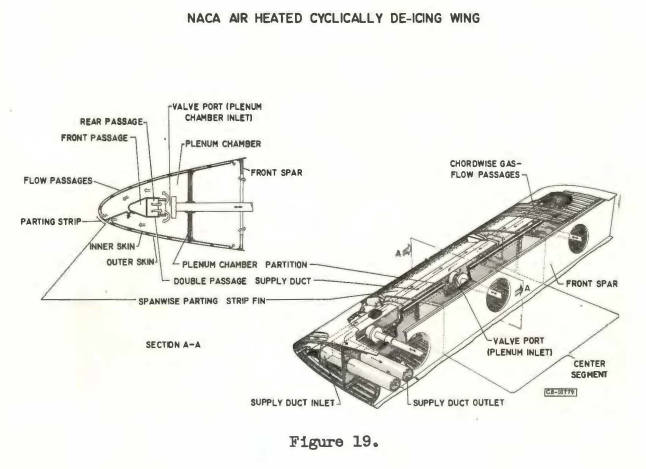
Numerous thermal cyclic de-icing systems were studied in the Lewis icing tunnel, typical of which was the hot gas cyclically de-iced airfoil shown schematically in figure 19. The initial NACA de-icing consisted of a conventional double akin, a two-way hot gas supply duct with valves for cycling the hot gas into the plenum or D-duct running spanwise at the leading edge, and a conducting fin attached to the supply duct and airfoil akin at the leading edge near the stagnation region (ref. 26). A two-way gas supply duct was used so that the hot gas would flow outboard and return in an ad joining rear passage in order to maintain a constantly hoc supply line. The valve in the supply line open in spanwise sequence, thereby permitting a constant flow of gas in the forward passage and greatly avoiding thermal lags. Because the forward passage is continuously heated, the fin conducts heat to the akin at the stagnation region, thereby providing a narrow ice-free spanwise parting atrip. This ice-free parting strip splits the ice cap that usually forms over the nose of the airfoil and facilitates ice removal by aerodynamic forces during the heating period.
The model was extensively instrumented with thermocouples in the akin and structural members and in the air passages in chordwise planes at several spanwise locations. Flow to the various sections was carefully metered by orifices in the air-supply lines. Timing of the fast-acting pappet-type cycle valves was made with electronic timers.
The results obtained from extensive studies of this model (refs. 26 and 27) show that savings in total heat input of as much as 75 to 90 percent of the heat required to prevent ice on the same wing were achieved. Similar results were obtained at both the NACA (ref. 28) and NAE facilities with electrically de-iced airfoils. Subsequent studies with a 36° swept wing (ref. 17) show that the tangential air-flow component along the span is sufficient to eliminate the need of a spanwise ice-free parting strip for facilitating removal of the ice formation. Systems similar to the NACA hot-air cyclic de-icing systems are currently being used by some manufacturers in the latest jet aircraft.
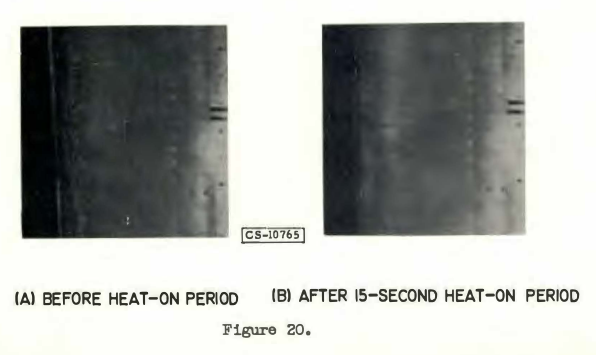
The use of a cyclic de-icing system necessitates an evaluation of the aerodynamic penalties associated with the ice formations permitted to build up during the unheated portion of a cycle (fig. 20). A number of airfoil models were tested to obtain the drag characteristics of cyclically de-iced airfoils in icing conditions (refs. 17 and 18). The results of these tests show that the drag and lift changes averaged over a cycle do not constitute a serious operational hazard if the length of the cycle can be adjusted to the severity of the icing condition.
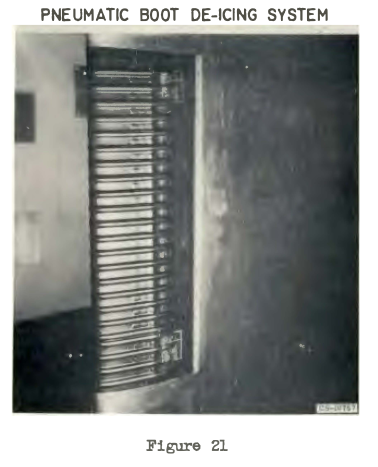
In addition to thermal de-icing systems, ice can be removed from most airfoil surfaces by a mechanical de-icing system consisting of a high-pressure pneumatic boot (fig. 21). In this system, inflatable tubes are sandwiched between two layers of rubber or neoprene. When ice forms on the outer surface of the boot, compressed air is bled periodically into the tubes which then inflate for a period of 3 to 6 seconds. Vacuum is applied to the tubes to maintain the surface flush during the off part of the cycle. Studies in the icing tunnel show that these deicers will effectively remove the main ice formations, however, the small flakes of residual ice adhering after the removal cycle will cause a section-drag increase of up to about 30 percent (unpublished data). Experimental studies indicate that removal of these residual ice formations by sublimation is a long process (ref. 29). These drag increases, therefore, can penalise aircraft performance over a much longer portion of the entire flight than for juat the dura tion of the icing encounter.
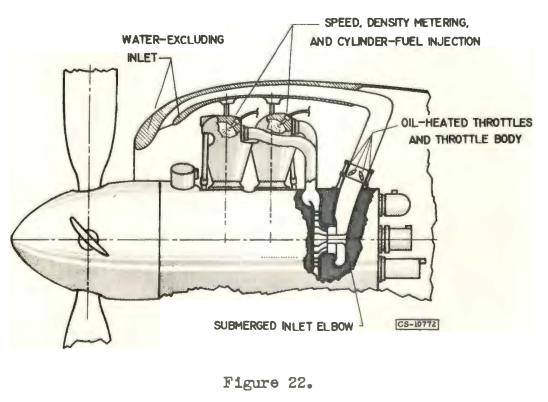
The engine is the most vital component on the airplane requiring icing protection. Work on icing protection for engine air inlets and induction systems covered piston and jet engines. The work on piston engines, summarized in an NACA technical report (ref. 30), led to the recommendations incorporated in figure 22 for a typical arrangement of an engine induction system. Such a design includes (1) an air inlet, which reduces the intake of water and snow to a minimum by utilizing the inertia and momentum differences between air and water particles to separate the droplets out of the air at the inlet, (2) aerodynamically clean flow passages to prevent ice accretion on exposed parts, (3) air-metering device, located in a warm, dry region, (4) throttle and throttle bodies kept above freezing, and (5) fuel injected downstream of the heated surfaces to prevent fuel-evaporation icing. Aircraft that incorporate many of these features, including the inlet type shown, are the Convair-240 and some versions of the Lockheed Constellation.
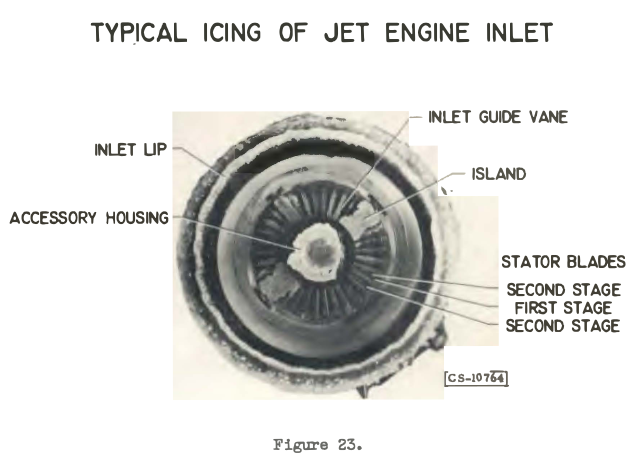
The high speeds of jet-powered aircraft and the large engine air flows necessitated a reappraisal of the icing problem for jet engines compared with that for the reciprocating engine. While the early centrifugal jet engines were not generally critical with respect to inlet and engine icing, because of engine geometry and structure, the axial-flow engine, were adversely affected by icing. The icing of engine inlet guide vanes (refs. 31 to 33) and inlet screens constituted an icing hazard (fig. 23) that not only reduced the available thrust and increased specific fuel consumption but could cause engine failure. The icing hazard of fixed inlet screen was aptly demonstrated by the simultaneous loss of eight F-84 aircraft over Indiana after a brief encounter with severe icing conditions in 1951. Tests in the Lewis icing tunnel also showed that the pressure loss associated with icing of guide vanes could cause large pressure losses and hence thrust losses (ref. 33). Several icing protection systems using alcohol or hot gas injection into the airstream to provide protection for the screen, accessory housing, and guide vanes were studied by NACA and NAE. With these systems, however, contamination of the compressor air (which is often used for cabin pressurization) or large thrust losses resulted.
The use of thermal icing protection for most engine components appeared most feasible. In the case of the screen, however, electro-thermal means did not appear attractive because uf the large heating rates required. Consequently, the complete elimination of the screen or retraction during an icing encounter appeared mandatory. Elimination of the screen exposed the engine to damage from ice chunks breaking off from unprotected components ahead of the compressor and entering the engine. Practically all types of axial-flow engines tested at the military services Mt. Washiqton icing facility have suffered partial or complete engine failure from insestion of such ice chunks. Thermal icing protection is required, therefore, for all components of the engine inlet that may shed these ice chunks if left unprotected.
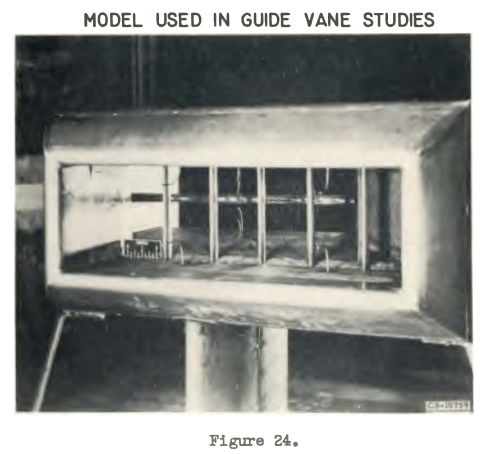
In the axial-flow engine the inlet guide vanes upstream of the compressor ice quickly. Complete icing protection of these members is required if the engine is to function in icing conditions. A study of means for heating the guide vanes internally with hot air was conducted with a cascade of five vanes mounted in a rectangular duct set in the icing tunnel (fig. 24).
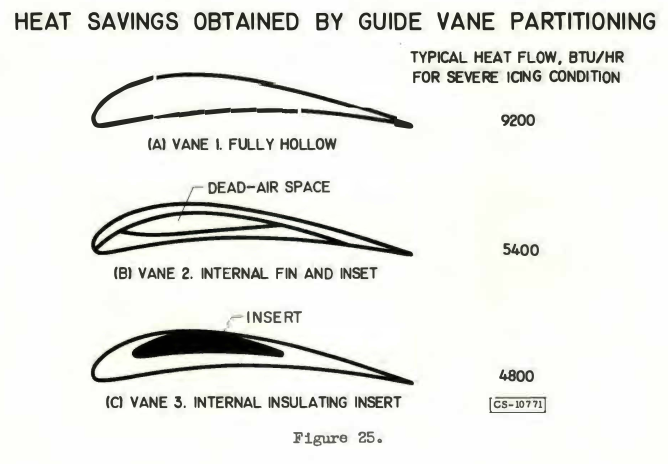
Ice collected on the Leading and trailing edges of the highly cambered blades used for inlet guide vanes. For this reason, a saving of 50 percent of the heating air flow (fig. 25) is achieved if the interior of the vane is partitioned to restrict this hot air to the areas of the blade on which ice collects. This partitioning of guide vanes has been adopted for some current engines.
Because the engine accessory dome collects ice that may break off after reaching a destructive size and enter the engine, research was conducted on the heating requirements for several jet-engine accessory domes. An electrical icing protection system was used in order to obtain selective and controlled heating and thereby verify theoretical local heat-transfer data (ref. 22 and unpublished data). The domes were tested also with rotation to simulate turboprop installations in order to study the effect of rotation on heating requirements. In general, the rotational effect was negligible for the size models tested.
While it is apparent that aircraft operating at relatively low air-speeds and at altitudes less than 20,000 feet will require airframe icing protection equipment, high-speed, high-altitude aircraft, on the other hand, may require little if any such equipment. These aircraft cruise at altitudes where little or no icing occurs. Studies in high-speed icing duct tunnels (refs. 34 to 36) show that icing can occur at speeds up to a Mach number of approximately 1.3; however, because of aerodynamic heating of the surfaces at this high speed, such icing conditions would require low air temperatures. The frequency of encountering severe icing at low air temperatures on a statistical probability basis is almost negligible. The icing problem for these aircraft, therefore, is confined primarily to climb and let down conditions. Because of their high rates of ascent and descent, the icing encounters for these aircraft are of short duration. Consequently, the flight plan and aircraft mission are becoming increasingly more important in determining the necessity for airframe icing protection equipment.
A limited operational analysis of an interceptor and a transport aircraft was presented in a paper by the author at an NACA conference on Some Problems of Aircraft Operation (Nov. 17-18, 1954). This study showed that thin-winged interceptor aircraft with a high rate of climb and descent and cruising at high altitude do not appear to require an airframe icing protection system except possibly during a landing operation. This study suggested that a partial or a simple one-shot icing protection system could be installed at minimum weight, structural, and performance penalty to cope with an icing encounter during landing. The study also concluded that jet transports, because of their slower rates of ascent and descent, should be provided with an airframe icing protection system. Since the engine is so vulnerable to ice damage, complete engine protection is required for both types of aircraft.
In summary, therefore, the NACA research programs have provided sufficient data or have established techniques whereby icing-protection requirements for most aircraft components can be determined sufficiently accurately for engineering purposes. The data obtained have been generalized whenever possible; however, it is recognized that certain specific installations at present still require testing in an icing tunnel or in flight. Meteorological studies are providing sufficient information on conditions conducive to icing on which to base the design requirements of aircraft components and to determine the need of icing protection for specific aircraft and flight plans. While this paper deals primarily with NACA studies in icing research, the contributions of other agencies including the groups operating at the Mt. Washington facilities, the U.S. military establishments, the U. S. aviation industry, the Canadian NAE, and other groups in the United States, Great Britain, and France must also be recognized. All these groups have cooperated and exchanged ideas that have aided in the successful solution of many icing problems.
Appendix A
APPENDIX A ICING TUNNEL FACILITIES
The amount of time required for both aircraft and equipment maintenance to obtain sufficient data in flight toward the solution of icing problems, together with the difficulty of obtaining data in specified, controlled icing conditions, resulted in the design and construction of an icing wind tunnel at the NACA Lewis laboratory in 1943-1944.
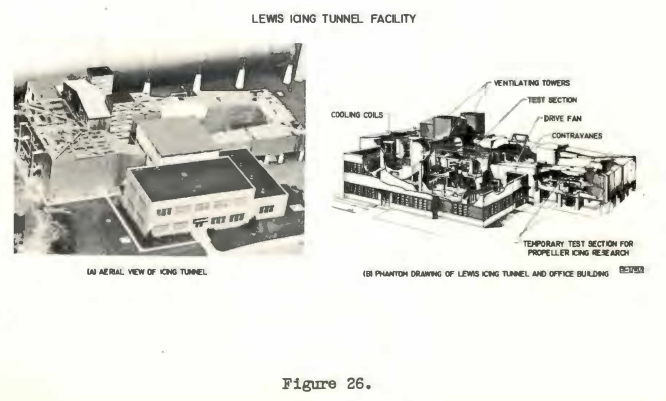
The Lewis icing tunnel ia a single-return closed-throat tunnel, the general arrangement of which is shown in figures 12 and 26. The tunnel is constructed of steel plate and is insulated with a 3-inch thickness of Fiberglas. The outer nonstructural shell covering the insulation is made of 1/8-inch steel sheets.
The tunnel is anchored at each end of the test section and at each end of the drive motor and supported by columns and sliding expansion joints at all other points in order lo allow movement due to temperature stresses. The over-all size of the tunnel shell is about 198 feet long and about 75 feet wide. The test section and a portion of the entrance core and diffuser ars surrounded by a steel housing to provide space for the essential test equipment and operating personnel. This space is called the test chamber. Because the test section is vented to the chamber, the air pressure decreases in the chamber during operation of the tunnel (normally less than 3 in. Hg). An air lock is provided lo permit access by personnel to the chamber during a run.
The test chamber contains three floor levels: the ground floor, containing electrical, thermocouple, water, and balance-scale equipment; the second floor, containing the test section of the tunnel and the various controls, manometers, recording instruments, and associated equipment; and the third floor, containing auxiliary measuring equipment. Personnel access to the tunnel is generally from the second floor of the test chamber, while models are lowered into the test section from the third floor through a removable 48- by 140-inch access hatch in the roof of the test section.
The test section is rectangular in shape, 9 feet wide, 6 feet high, and 20 feet long. The air enters the test section from a large rectangular section giving a contraction ratio of about 14 to 1. The test section of the tunnel is provided with a turntable on which models can be mounted, as well as side-wall trunnion mounts. The maximum tunnel airspeed with icing conditions and a large model in the test section is 260 knots.
Windows are provided on both sides and in the roof of the tunnel test section to allow observation of models during a test, The windows in the tunnel sides are laminated, electrically heated units similar to windshields on many aircraft, while the windows in the test section roof are unheated. The power supplied to the new window, currently being installed is 500 watt, per square foot. The temperature of the plastic inner layer of the window is detected by a nickel wire element. Thia element is used in a bridge circuit to control the window temperature.
Turning vane, are used in all right-angle corner, of the tunnel. The vane downstream of the test section and ahead of the drive fan are steam-heated to prevent icing.
The drive motor for the tunnel develop, 4160 horsepower. The drive consists of a doubly fed wound-rotor induction motor. Power is supplied directly to the 1tator, while the power for the rotor is supplied by a four-machine variable and fixed frequency setup. A variable-speed d-c motor, driven according to the Ward-Leonard system, drives an a-c generator. The generator applies the power to the tunnel drive-motor rotor. The speed of the drive motor is governed by the speed of the a-c generator or d-c motor, the speed of these machines being controlled by varying the voltage to the d-c motor. The drive motor has a speed range from O to 540 rpm. A 200,000- cubic-foot-per-minute, 5O-horsepower blower is used to cool the drive motor.
The tunnel drive motor is coupled directly to a 25-foot-diameter drive fan with 12 blades. The fan blades are wooden, with the leading edges of the blades protected by neoprene abrasion shoes. Stationary contra-vanes are used ahead of the fan.
A ventilating tower is located downstream of the drive motor. Thia tower permits an exchange of tunnel air with outside air. The primary use of this unit has been to provide an additional cooling load to help regulate the tunnel air temperature for certain test conditions. In addition, a finned-tube heat exchanger with a capacity of 5,000,000 Btu per hour is available to aid in regulating the tunnel air temperature.
A compression-type refrigeration system located in a nearby building is used to cool the tunnel air to the required icing condition. The tunnel is cooled by passing the air over a bank of refrigerated finned heat exchangers located in an area between the drive motor and the tunnel spray system. The total refrigeration capacity is about 7700 tons. The normal cooling load for the icing tunnel requires from 1200 to 2100 tons; however, this requirement varies with climatic conditions. Air temperatures as low as -40° C can be obtained, although moat tests are conducted in the range of -3° to -20° C.
Icing conditions similar to those encountered in the atmosphere are created by a battery of air-water atomising nozzles. A view of the spray system looking downstream into the test section is shown in figure 13. The spray nozzles are mounted in six horizontal spray bars and located to give a uniform cloud approximately 4- by 4-feet in the test section. Controls for the spray system are located in airfoil-shaped enclosures at one end of each strut.
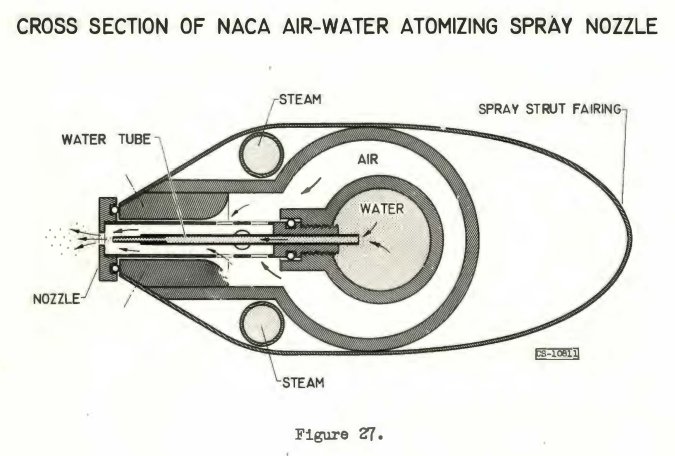
A sketch of the air-water atomizing nozzles used in the spray system is shown in figure 27. The nozzle assembly consists of air and water supply lines, steam line to prevent icing of the entire strut, and the spray nozzle (Inconel). Approximately 80 nozzles are used to obtain an adequate cloud in the tunnel. The nozzles were specially developed for the tunnel to yield droplet sizes ranging from a mean effective size of 4 micron at low water flow, to about 20 micron, at maximum water flowa. Air pressures of 60 to 80 pounds per square inch are used normally to atomize the water, while the water pressures range from a few pounds above the air-pressure values up to 140 pounds per square inch. The large water-pressure values correspond to large water flows and large droplet sizes. The droplets produced by these nozzles are not uniform in size but vary approximately in accordance with a Langmuir D or E drop-size distribution (ref. 37). For a constant water flow, the liquid-water content in the tunnel varies with the airspeed. In addition, the contraction of the tunnel entrance cone affects the droplet paths and local water concentration in the tunnel. Consequently, maximum or minimum values of water content and droplet size independent of tunnel air-speed cannot be stated explicitly.
The water used for the spray system passes through a 500-gallon-per- hour-capacity demineralizer. The demineralizer consists of two anion and cation filter beds that remove all minerals from the water, thereby preventing fouling and plugging of the spray system. From the demineralizer, the water is piped into a storage tank with a capacity of 750 gallons. The storage tank is kept full by a float switch that turns the demineralizer on and off to maintain a given water level in the storage tank. From the storage tank the water is piped to two turbine water pumps with a capacity of 5 gallons per minute each at 15O pounds per square inch gage. The water is pumped through three rotameters for flow measurement and then into a steam heat exchanger that heats the water to a temperature of 80° to 90° C. Heating of the water is necessary to prevent freeze-out of the water when it is air-atomized to cloud droplets in the tunnel. Following the heat exchanger the water is filtered at each strut control box. The water pressure is regulated at each strut by a pressure regulator controlled by the tunnel operator. The water pressure is sensed by a pressure transmitter, which changes water pressure to pneumatic pressure. The water pressures in each spray strut (in the form of pneumatic pressure) are indicated on a manometer board in the test chamber.
Air is furnished to the water-spray system from a service air line with a capacity of 6 pounds per second at 120 pounds per square inch. This air is passed through a pressure regulator, a steam heat exchanger (which heats the air to approximately 80° to 90° C), and a two-stage filter before entering the strut control boxes. The air pressure is also controlled from the test-chamber control area.
A separate spray system consisting of 4 to 9 nozzles is used to inject dyed water into the tunnel for experimental studies of droplet impingement characteristics of various bodies (ref. 15).
A balance frame is provided with a 6-component force-measuring scale system. Data are recorded automatically on tapes at each balance. Electrically heated co-axial pressure tubes are used to obtain pressure data. All pressure data are recorded photographically from multi-tube manometer boards. Temperature data obtained with copper-constantan thermocouples are recorded on automatic flight recorders. The control equipment includes variable transformers for power control to models, automatic temperature controller for heated air to models, and various recording instruments for heat-source control. Standard instruments are used to record tunnel air-speed and air temperature. An NACA pressure-type icing-rate meter is used to measure the liquid-water content of the tunnel atmosphere. Special instrumentation is added whenever required for a particular study.
Heated air for providing models with icing protection is supplied by three heat exchangers. The air from these exchangers is heated by the exhaust from a jet-engine combustion can. Each heat exchanger has a flow capacity of 1000 pounds per hour with pressure regulation up to 120 pounds per square inch. Orifices in each line allow a measurement of the flow from each exchanger. Constant air temperature over a wide range of air flows is obtained byan automatic flow control that regulates the amount of cold air permitted to mix·with heated air from the exchangers.
Electric heating supplied to models for icing protection can be obtained from either a-c or d-c sources; however, a-c is generally preferred. The d-c system capacity is 28 volts and rated at 100 amperes. In addition, a 12-volt d-c system rated at 50 amperes is also available. A 29-volt a-c system rated at 50 amperes is available and is used for heater studies for which the heater load is normally run on d-c. A 110-volt single-phase system and a 208-volt, three-phase, 50-ampere system are available for large electrical loads. Selective power inputs (a-c three-phase system) to electrically heated models are metered (power recorded on a recording wattmeter) by means of 18 variable transformers rated at 3 amperes, 16 variable transformers rated at 9 amperes, and 3 variable transformers rated at 45 anr peres. A 400-cycle inverter capable of supplying 1,500 volt-amperes at 115 volts is also used for some instrument tests.
Electronic timers are available by which specified heating and icing periods for either electric or air heating systems can be controlled.
The 136-inch-high multi-tube manometer board is so arranged that it may operate as an integrating type or a standard board. A total of 298 readings can be obtained from the board. Additional U-tube and standard manometer boards are available as required. Most of the tubes are also connected to an air-purge system by which air is bled through the tubes back to the model. An air-operated cylinder or pincher closes off the tubes at the manometer to prevent the purge air from blowing the manometer fluid out of the bonds. The purge air prevents the entry of water from the spray cloud into the tubes and blocking or freezing of the unheated portions of the pressure lines. During this purging procedure, no manometer-board readings are taken.
For aerodynamic studies of airfoils in icing conditions, the airfoil surfaces aft of the region protected by the icing protection system (called afterbody) are generally heated. This heating is required, since the turbulence level and supersaturated air in the test section cause a frost deposit on the cold portions of a model. These deposits have rarely been observed in natural flight icing. Such frost deposits increase the measured model drag. A steam line operating at +5 to -3 inches of mercury is used to heat these afterbodies. To avoid steam leakage from the model into the tunnel, the afterbody is operated at a negative pressure by means of a small ejector and a barometric condensor located externally of the model.
Photographs of ice formations during a test are obtained with high-speed electronic flash equipment, while conventional camera equipment is used for pictures taken in the tunnel at the conclusion of a test. Color photography has proved to be the most satisfactory for movie film recording of data in the presence of the spray cloud.
Airfoil models normally span the vertical height of the tunnel. Chords of these models have ranged from 13 to 96 inches or larger. Horizontal model mounting has also been used occasionally; however, because of wind- tunnel-wall interference effects, the vertical mounting is preferred. Bodies of revolution and inlets tested are normally less than 36 inches in diameter.
In addition to the 6- by 9-foot icing tunnel, two smaller high-speed icing-duct tunnel facilities are also used. Techniques equivalent to those just described are used in these tunnels. A schematic diagram of the 3.84- by 10-inch tunnel presented in figure 28 shows the inlet diffuser section with screens, the plenum chamber with flow straightening tubes, the bell-mouth tunnel entry, the test section, and the outlet diffuser section. The tunnel is designed to provide a range of subsonic Mach numbers from 0.3 to 0.8 and a supersonic Mach number of 2.0. Altitudes up to 30,000 feet may be simulated.
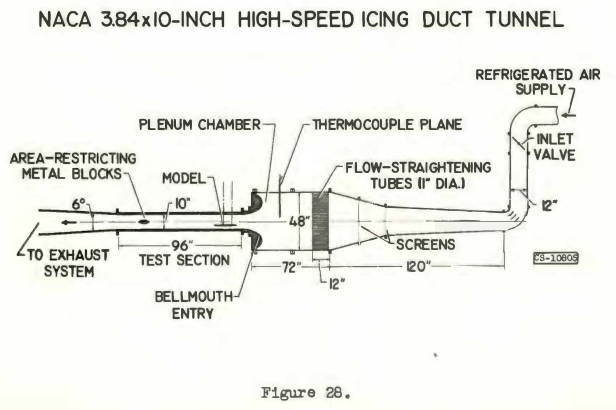
A supply of refrigerated air initially at approximately -20° F and with a specific humidity of 5.0x10⁻⁴ pound of water per pound of dry air is conditioned to provide the desired temperatures and humidities at the tunnel test section. The humidity of the airstream is controlled by means of steam injected at a point sufficiently far upstream to ensure thorough mixing at the tunnel entry.
One wall of the tunnel contains a large glass section for observation and visual measurements. The other wall has five portholes for access to the inside of the tunnel and removable plugs for installation of instrumentation at various stations along the tunnel. Permanent instrumentation of the tunnel at the test section includes static-pressure taps along the top and bottom surfaces of the tunnel and pressure taps and thermocouples in the plenum chamber.
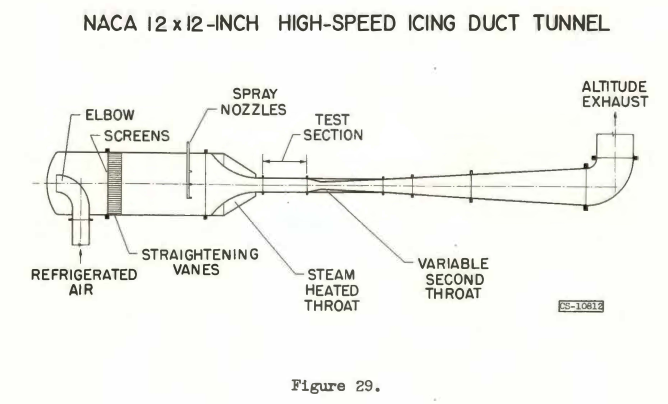
A schematic diagram of the component parts of a 12- by 12-inch icing duct tunnel is shown in figure 29. The tunnel characteristics are in general similar to the 3.84 - by 10-inch tunnel. Subsonic speeds up to Mach number of 0.75 can be achieved with small airfoil models. For icing studies the airspeed is maintained in the subsonic and low supersonic speed ranges.
Appendix B
OPERATIONAL TECHNIQUES
The following are techniques used for model testing in the Lewis icing tunnel and associated facilities.
Thermocouple Installations
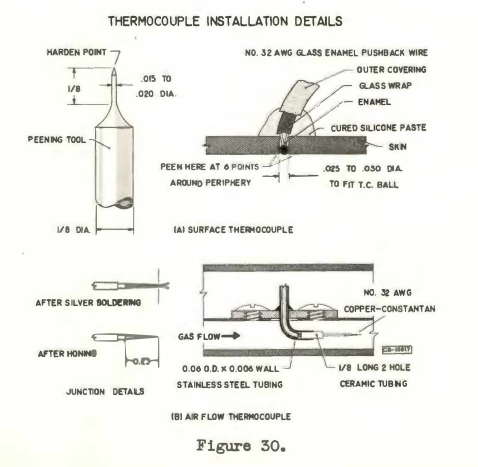
Whenever possible, all skin or surface thermocouples (copper-constantan) are peened into small holes drilled into the surface as shown in figure 30. The ball at the junction of the thermocouple is just large enough to fit into the hole, so that peening the surface around the ball will result in a firmly anchored thermocouple. The ball should be as close to the outer surface of the skin as possible. For very thin metal skins (0.005-inch stainless steel, e.g.) spot-welding the thermocouple on the inner surface of the skin is acceptable. The thermocouple leads should not be secured on the outer surface of the model, since ice will anchor on the leads. If splicing of thermocouple leads is required, such splices should be made in a protected, constant-temperature location, outside the model in the test chamber. All thermocouple leads should be protected against moisture; asbestos-covered wires are not generally recommended for models in icing conditions. Shielded thermocouples are recommended for obtaining measurements of hot air temperature, although a trailing thermocouple such as that shown in figure 30(b) is acceptable.
Tunnel Air Temperature
The tunnel air temperature is obtained with a probe that separates the entrained water from the airstream as shown in figure 31.
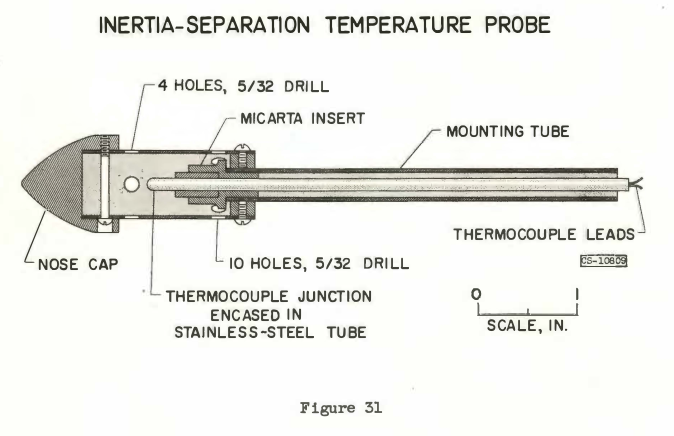
The probe consists of a nose and rear cap and a housing containing a temperature-sensing element. Holes are located in the housing so that the air flows through the probe from the rear to the front of the probe. The locations of these holes are based on pressure-distribution studies. The water droplets, because of their inertia, do not enter the housing at the rear locations.Because the nose-cap diameter is larger than the housing diameter, the housing is protected from icing. The nose cap is allowed to ice. Thermal icing protection could be incorporated in the nose cap; however, an error in the indicated temperature would be incurred. The average. temperature-recovery factor for these probes is about 84 percent and is constant over a range of Mach numbers from 0.2 to 1.0. In the NACA icing tunnel the probes are used to measure air temperature in the low-speed section upstream of the spray system and ahead of the contraction cone. The air temperature measured by these probes is therefore essentially a total air temperature. Because the tunnel is always at least saturated when the sprat system is used, the ambient-air temperature in the test section is computed by conventional wet-air equations (ref. 21). The total air temperature measured in the low-speed section of the tunnel is used for a base in these calculations.
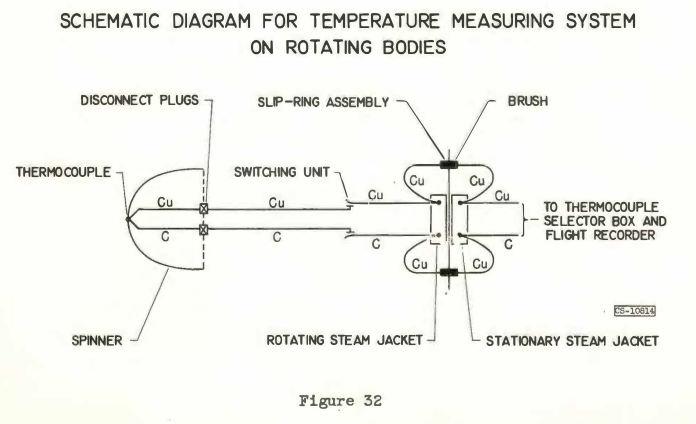
Temperatures from Rotating Bodies
A typical means used to transmit the temperatures from a rotating body to a recorder ia shown schematically in figure 32. The thermocouple leads from the body are fed through a hollow motor shaft to the rear of a motor housing and through a thermocouple selector switch into a steam-filled jacket that rotates with the shaft. From the rotating jacket, copper leads are attached to a slip-ring and brush assembly. From this assembly a copper leads are again led into a steam-filled stationary jacket. Copper-constantan leads are used from the stationary jacket to a thermocouple selector unit and to a flight recorder. The steam jacket is used to provide a constant temperature at critical junctions in the thermocouple circuit, where the wire metal in the thermocouple leads is changed from copper and constantan to all copper and back again.
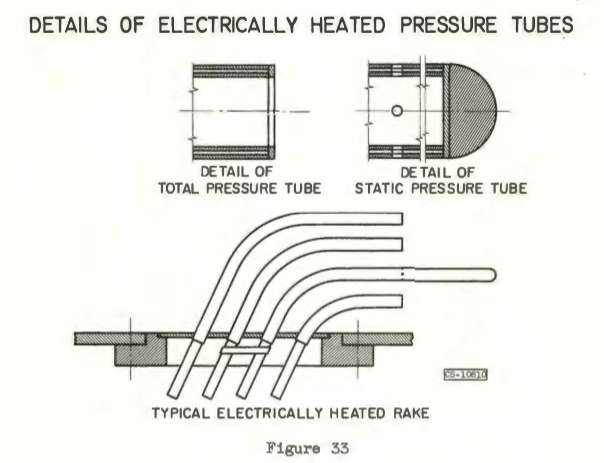
Pressure Tubes
In icing conditions all pressure tubes subject to water impingement (pitot-static tubes, tubes in survey rakes and in the boundary layer, etc.) must be protected against icing. In the Lewis icing tunnel such pressure tubes are generally electrically heated. A co-axial tube is used consisting of two concentric tubes separated by a woven glass sleeving insulation (fig. 33). The ends of the tubes exposed to the airstream are silver-soldered and shaped to obtain either static or total-pressure tubes. Tube sizes of 0.093- to 0.437-inch outside diameter and 0.057- to 0.393-inch inside diameter with wall thicknesses of 0.005 inch are in common usage. These tubes are made of Inconel. A special tube bender was developed by NACA personnel to avoid collapsing of the co-axial tubing during bending of the tubes to a desired shape.
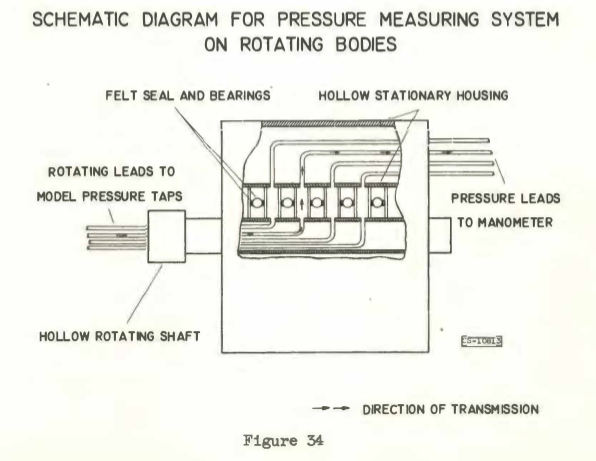
Surface Pressure from Rotating Body
A scheme similar to that used to obtain temperatures from rotating bodies is also used to obtain surface pressure measurements. Pressure lines from a model are fed into a hollow shaft (fig. 34). Each tube is then allowed to vent into a chamber composed of the hollow shaft, bearings, and a stationary housing. All pressure sealing is accomplished by the bearings and felt seals. The pressure from each sealed chamber is then transmitted to a manometer. A water-jacket cooling system (not shown) is provided for high-rotational-speed operation. This pressure system permits simultaneous readings of many pressures and is generally limited only by the number of bearings used.
APPENDIX C
ICING INSTRUMENTS
The determination of liquid-water content and droplet-size distribution of natural and artificial clouds has received considerable attention in connection with cloud physics studies and, in particular, in aircraft icing studies. A knowledge of the liquid-water content and droplet-size distribution in clouds is of fundamental importance in evaluating rate and area of ice formation on various aircraft components, rate and area of erosion by impinging droplet, on various aircraft surfaces such as radmes, reduction of visibility, attenuation of radar, and the basic mechanism of cloud formation and precipitation.
Numerous methods for determining these parameters have been proposed and tested, but each method suffers limitations as to accuracy or ease in obtaining or reducing the data to useful form. In some cases the limitations become very severe when measurements are attempted in high-speed air-streams. In addition to the rotating multicylinders and pressure-type icing-rate meter discussed in the test, some methods and techniques that have been widely employed to determine liquid-water content and/or droplet size are:
(1) Cloud camera
(2) Oil slides
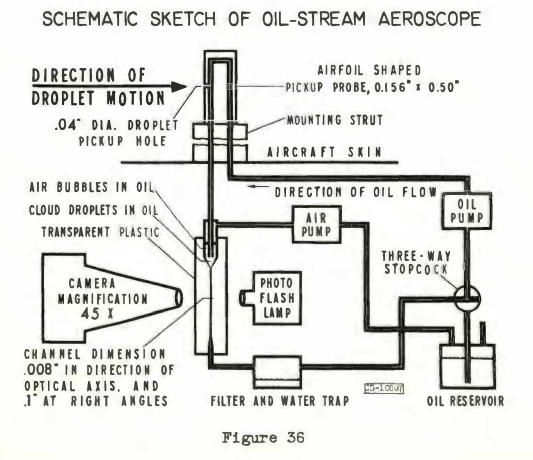
(3) Oil-stream aeroscope
(4) Heated probes
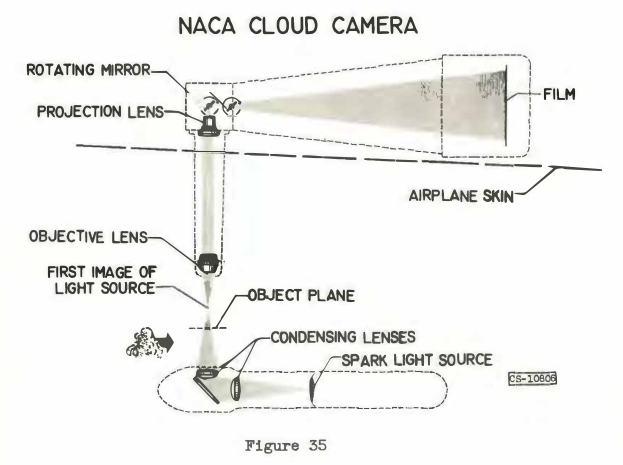
The methods are described and discussed in references 38 to 40. The use of cameras (fig. 35) to photograph droplets directly in a cloud (ref. 38) is based on fundamental principles and is basically a sound technique, but there are practical difficulties. Because of the high magnification required, the volume of the field of view is extremely small. As a result, the average number of droplets per 8- by 10-inch picture is small in clouds of moderate liquid-water contents. Therefore, a large number of pictures are required in order to obtain a size distribution. Since the magnification required is high, it is difficult to design a ca1Bera ao that the object plane is outside the undisturbed airstream about an airplane or camera mount.
The oiled-slide technique, where a glass slide covered with a suitable oil is exposed to a droplet-laden airstream and is then photographed through a microscope, has been used also to determine droplet-size distributions. This method yields photographs with a large number of droplets per picture from which the droplet sizes may be measured. However, because of the relatively large size of the slide compared with the size of droplets, the overall collection efficiency and the local collection efficiencies of the slide vary considerably with droplet size. The droplet-size distribution for any given area of the slide must be corrected according to the local collection efficiencies in order to obtain the true droplet-1i1e distribution of the cloud. The local collection efficiencies used for thia correction are baaed upon that of a ribbon in ideal two-dimensional flow. The exposure time required in order not to saturate the slide with droplets must be of the order of a fraction of a second. This presents some difficulties, in that the slide must be moved rapidly or a protective cover must be opened and closed rapidly. This motion disturbs the airflow field in the vicinity of the slide, and therefore the collection efficiencies of the slide are not the same as for a ribbon in ideal flow.
An oil-stream aeroscope composed of five main parts (fig. 36) - droplet pickup probe, circulating pumps for oil and air, photographic cell, light source, and a photomicrographic camera - has been developed. The droplet pickup probe consists of a small-diameter tube with a small hole on one side. When operating, the probe is arranged so that the small hole faces upstream to the air flow carrying the cloud droplets. Oil is forced by a pump through the pickup probe in the direction indicated in the sketch. As the oil passes the small hole, any water droplets that enter are trapped in the oil. Oil does not flow out of the droplet pickup hole, because the oil pressure is maintained at atmospheric pressure by the air pump shown in figure 36. The oil containing the droplets then flows through the transparent plastic cell where the droplets are photographed with a photomicrographic camera. The channel through the plastic cell narrows down at the point where the pictures are taken, so that all the droplets are approximately in the object plane of the camera. After leaving the plastic cell, the oil passes through a filter and trap where the water droplets are removed. The droplet size and distribution can then be determined by measuring the images on the photographs from the known magnification. After the droplet distribution is known, the liquid-water content of the cloud can be calculated from the known geometry of the instrument, the airspeed, and the oil-flow rate. Limited data indicate that this instrument shows excellent promise for obtaining the desired information.
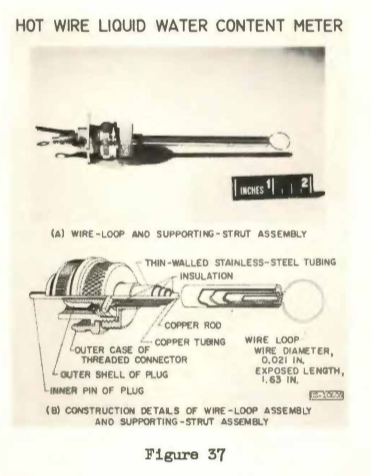
The heated-wire instrument consists basically of a loop of resistance wire (refs. 39 and 40) which is mounted in the airstream (fig. 37) and is heated electrically by passing current through the wire. The wire diameter is 0.021 to 0.064 inch, with a maximum power input of 31 to 300 watts, respectively (ref. 40). The change in wire resistance from the clear-air condition, resulting from cooling due to evaporation of impinging cloud water droplets, is used as a measure of the liquid-water content, or icing severity. Although the heated-wire instrument has several disadvantages as pointed out in reference 40, a workable instrument can be obtained that is very useful in studying cloud microstructure.
A variation of the heated-wire instrument is currently under development at the NACA Lewis laboratory. This instrument consists of a heated tube operating at constant surface temperature with a variable power input. This instrument has the following advantage, over a constant-power heated-wire probe:
(1) The measured change in required power is linear with water impingement,
because the surface temperature it fixed.
(2) The change of heat-transfer coefficient under all conditions is
minimized.
(3) The sensitivity to water impingement is maximized.
(4) The power input is easily measured.
(5) With proper design, the time constant is less than that of a wire
heated with constant power.
While the control circuit for this probe has proved formidable, a satisfactory unit has been designed and operated. The probe is currently being calibrated in the Lewis icing tunnel.
REFERENCES
- Hacker, Paul T., and Dorsch, Robert G.: A Summary of Meteorological Conditions Associated with Aircraft Icing and a Proposed Method of Selecting Design Criterions for Ice-Protection Equipment. NACA-TN-2569, 1951. ntrs.nasa.gov
- Lewis, William, and Bergrun, Norman R.: A Probability Analysis of the Meteorological Factors Conducive to Aircraft Icing in the United States. NACA-TN-2738, 1952. ntrs.nasa.gov
- Jones, Alun R., and Lewis, William: Recommended Values of Meteorological Factors to be Considered in the Design of Aircraft Ice-Prevention Equipment. NACA-TN-1855, 1949. ntrs.nasa.gov
- Brun, Rinaldo J., Lewis, William, Perkins, Porter J., and Serafini, John S.: Impingement of Cloud Droplets and Procedure for Measuring Liquid-Water Content and Droplet Sizes in Supercooled Clouds by Rotating Multicylinder Method. NACA-TR-1215, 1955. (Supersedes NACA TN’s 2903, 2904, and NACA-RM-E53D23) ntrs.nasa.gov
- Perkins, Porter J., McCullough, Stuart, and Lewis, Ralph D.: A Simplified Instrument for Recording and Indicating Frequency and Intensity of Icing Conditions Encountered in Flight. NACA-RM-E51E16, 1951. ntrs.nasa.gov
- Brun, Rinaldo J., Gallagher, Helen M., and Vogt, Dorothea E.: Impingement of Water Droplets on NACA 65A004 Airfoil and Effect of Change in Airfoil Thickness from 12 to 4 Percent at 4° Angle of Attack. NACA-TN-3047, 1953. ntrs.nasa.gov
- Brun, Rinaldo J., Gallagher, Helen M., and Vogt, Dorothea E.: Impingement of Water Droplets on NACA 651-208 and 651-212 Airfoils at 4° Angle of Attack. NACA-TN-2952, 1953. ntrs.nasa.gov
- Guibert, A. G., Janssen, E., and Robbins, W. M.: Determination of Rate, Area, and Distribution of Impingement of Waterdrops on Various Airfoils from Trajectories Obtained on the Differential Analyzer. NACA-RM-A905, 1949. digital.library.unt.edu
- Brun, Rinaldo J., Gallagher, Helen M., and Vogt, Dorothea E.: Impingement of Water Droplets on NACA 65A004 Airfoil at 8° Angle of Attack. NACA-TN-3155, 1954. ntrs.nasa.gov
- Brun, Rinaldo J., Serafini, John S., and Gallagher, Helen M.: Impingement of Cloud Droplets on Aerodynamic Bodies as Affected by Compressibility of Air Flow Around the Body. NACA-TN-2903, 1953. ntrs.nasa.gov
- Dorsch, Robert G., and Brun, Rinaldo J.: A Method for Determining Cloud-Droplet Impingement on Swept Wings. NACA-TN-2931, 1953. ntrs.nasa.gov
- Brun, Rinaldo J., and Dorsch, Robert G.: Impingement of Water Droplets on an Ellipsoid with Fineness Ratio 10 in Axisymmetric Flow. NACA-TN-3147, 1954. ntrs.nasa.gov
- Dorsch, Robert G., Brun, Rinaldo J., and Gregg, John L.: Impingement of Water Droplets on an Ellipsoid with Fineness Ratio 5 in Axisymmetric Flow. NACA-TN-3099, 1954. ntrs.nasa.gov
- Brun, Rinaldo J., and Mergler, Harry W.: Impingement of Water Droplets on a Cylinder in an Incompressible Flow Field and Evaluation of Rotating Multicylinder Method for Measurement of Droplet-Size Distribution, Volume-Median Droplet Size, and Liquid-Water Content in Clouds. NACA-TN-2904, 1953. ntrs.nasa.gov
- von Glahn, Uwe H., Gelder, Thomas F., and Smyers, William H., Jr.: A Dye-Tracer Technique for Experimentally Obtaining Impingement Characteristics of Arbitrary Bodies and a Method for Determining Droplet Size Distribution. NACA-TN-3338, 1955. ntrs.nasa.gov
- Sherman, P., Klein, J. S., and Tribus, Myron: Determination of Drop Trajectories by Means of an Extension of Stokes' Law. Eng. Res. Inst. Air Res. and Dev. Command, USAF, Univ. Mich. Apr. 1952. (Contract AF 18 (600)-1, Proj. M992-D.) deepblue.lib.umich.edu
- von Glahn, Uwe H., and Gray, Vernon H.: Effect of Ice Formations on Section Drag of Swept NACA 63A-009 Airfoil with Partial-Span Leading-Edge Slat for Various Modes of Thermal Ice Protection. NACA-RM-E53J30, 1954. ntrs.nasa.gov
- Gray, Vernon H., and von Glahn, Uwe H.: Effect of Ice and Frost Formations on Drag of NACA 651-212 Airfoil for Various Modes of Thermal Ice Protection. NACA-TN-2962, 1953. ntrs.nasa.gov
- Lewis,James P., and Blade, Robert J.: "Experimental Investigation of Radome Icing and Icing Protection", NACA-RM-E52J31, 1953. ntrs.nasa.gov
- Neel, Carr B., Jr., Bergrun, Norman R., Jukoff, David, and Schlaff, Bernard A.: The Calculation of the Heat Required for Wing Thermal Ice Prevention in Specified Icing Conditions. NACA-TN-1472, 1947. ntrs.nasa.gov
- Gelder, Thomas F., and Lewis, James P.: Comparison of Heat Transfer from Airfoil in Natural and Simulated Icing Conditions. NACA-TN-2480, 1951. ntrs.nasa.gov
- von Glahn, Uwe H.: Preliminary Results of Heat Transfer from a Stationary and Rotating Ellipsoidal Spinner. NACA-RM-E53F02, 1953. ntrs.nasa.gov
- Gelder, Thomas F., Lewis, James P., and Koutz, Stanley L.: Icing Protection for a Turbojet Transport Airplane: Heating Requirements, Methods of Protection, and Performance Penalties. NACA-TN-2866, 1953. ntrs.nasa.gov
- Hardy, J. K.: Kinetic Temperature of Wet Surfaces A Method of Calculating the Amount of Alcohol Required to Prevent Ice, and the Derivation of the Psychrometric Equation. NACA-ARR-5G13, 1945. ntrs.nasa.gov
- Hardy, J. K.: An Analysis of the Dissipation of Heat in Conditions of Icing from a Section of the Wing of the C-46 Airplane. NACA-TR-831, 1945. (Formerly NACA-ARR-4I11a.) ntrs.nasa.gov
- Gray, Vernon H., Bowden, Dean T., and von Glahn, Uwe H.: Preliminary Results of Cyclical De-icing of a Gas-Heated Airfoil. NACA-RM-E51J29, 1952. ntrs.nasa.gov
- Gray, Vernon H., and Bowden, Dean T.: Comparison of Several Methods of Cyclic De-Icing of a Gas-Heated Airfoil. NACA-RM-E53C27, 1953. ntrs.nasa.gov
- Lewis, James P., and Bowden, Dean T.: Preliminary Investigation of Cyclic De-Icing of an Airfoil Using an External Electric Heater. NACA-RM-E51J30, 1952. ntrs.nasa.gov
- Coles, Willard D., and Ruggeri, Robert S.: Experimental Investigation of Sublimation of Ice at Subsonic and Supersonic Speeds and its Relation to Heat Transfer. NACA-TN-3104, 1954. ntrs.nasa.gov
- Coles, Willard D., Rollin, Vern G., and Mulholland, Donald R.: Icing-Protection Requirements for Reciprocating-Engine Induction Systems. NACA-TR-982, 1950. (Supersedes NACA-TN-1993.) ntrs.nasa.gov
- Acker, Loren W.: Natural Icing of an Axial-Flow Turbojet Engine in Flight for a Single Icing Condition. NACA-RM-E8F01a, 1948. ntrs.nasa.gov
- Acker, Loren W.: Preliminary Results of Natural Icing of an Axial-Flow Turbojet Engine. NACA-RM-E8C18, 1948. ntrs.nasa.gov
- Gray, Vernon H., and Bowden, Dean T.: Icing Characteristics and Anti-Icing Heat Requirements for Hollow and Internally Modified Gas-Heated Inlet Guide Vanes. NACA-RM-E50I08, 1950. ntrs.nasa.gov
- Callaghan, Edmund E., and Serafini, John S.: A Method for Rapid Determination of the Icing Limit of a Body in Terms of the Stream Conditions. NACA-TN-2914, 1953. ntrs.nasa.gov
- Callaghan, Edmund E., and Serafini, John S.: Analytical Investigation of Icing Limit for Diamond Shaped Airfoil in Transonic and Supersonic Flow. NACA-TN-2861, 1953. ntrs.nasa.gov
- Coles, Willard D.: Icing Limit and Wet-Surface Temperature Variation for Two Airfoil Shapes under Simulated High-Speed Flight Conditions. NACA-TN-3396, 1955. ntrs.nasa.gov
- Langmuir, Irving, and Blodgett, Katherine B.: A Mathematical Investigation of Water Droplet Trajectories. Tech. Rep. No. 5418, Air Materiel Command, AAF, Feb. 19, 1946. (Contract No. W-33-038- ac-9151 with General Electric Co.)
- McCullough, Stuart, and Perkins, Porter J.: Flight Camera for Photographing Cloud Droplets in Natural Suspension in the Atmosphere. NACA-RM-E50K01a, 1951. ntrs.nasa.gov
- Neel, Carr B., Jr., and Steinmetz, Charles P.: The Calculated and Measured Performance Characteristics of a Heated-Wire Liquid-Water-Content Meter for Measuring Icing Severity. NACA-TN-2615, 1952. ntrs.nasa.gov
- Neel, Carr B., Jr.: A Heated-Wire Liquid-Water-Content Instrument and Results of Initial Flight Tests in Icing Conditions. NACA-RM-A54I23, 1955. ntrs.nasa.gov
Notes
-
von Glahn, Uwe H.: The Icing Problem, presented at Ottawa AGARD Conference. AG 19/P9, June 10-17 1955. ntrs.nasa.gov ↩↩
-
"The Icing Problem" reprint included in NASA-TM-81651 "Selected Bibliography of NACA-NASA Aircraft Icing Publications", August, 1981. ntrs.nasa.gov ↩