"Use of the hot-gas method of anti-icing has been restricted ... because of difficulty in controlling the rate of heat dissipation"
"Improvements in Heat Transfer for Anti-Icing of Gas-Heated Airfoils with Internal Fins and Partitions" 1
Abstract
The effect of modifying the gas passage of hollow metal airfoils by the additIon of internal fins and partitions was experimentally investigated and comparisons were made among a basic unfinned airfoil section and two airfoil designs having metal fins attached at the leading edge of the internal gas passage. An analysis considering the effects of heat conduction in the airfoil metal was made to determine the internal modification effectiveness that may be obtained in gas-heated components, such as turbojet-inlet guide vanes, support struts, hollow propeller blades, arid. thin wings.
Over a wide range of heated-gas flow and tunnel-air velocity, the increase in surface-heating rates with internal fin was marked (up to 3.5 times), with the greatest increase occurring at the leading edge where anti-icing heat requirements are most critical. Variations in the amount and the location of internal finning and partitioning provided control over the local rates of surface heat transfer and permitted efficient anti-icing utilization of the gas-stream heat content.
Discussion
This publication is long (45 pages), and densely packed with information. This review is longer than most, but for brevity omits some important sections:
- Analysis of Flow Conditions
- Anti-Icing Evaluation of Airfoil Sections
Readers are encouraged to see those in the original publication.
This publication details several important test procedures, including an assessment of thermocouple installation error (which was found to be substantial, if not corrected).
The one-dimensional heat transfer analyses yield important information, and a two-dimensional thermal analysis is also included.
While this publication is about gas-heated airfoils, the lessons can be applied to any thermal test.
I consider this publication to be "required reading" for anyone doing anti-ice performance tests, or post-test analysis.
INTRODUCTION
Surface-ice prevention by the use of hot gas flowing through hollow airfoil shapes has long been considered because of advantages in weight, simplicity, availability of heating medium, and durability of installation. Use of the hot-gas method of anti-icing has been restricted, however, partly because of difficulty in controlling the rate of heat dissipation over the chordal and spanwise extent of the airfoil. A facility for concentrating the flow of heat toward the leading-edge surfaces, where the heat requirement for anti-icing is greatest, has been lacking. This deficiency has been analytically and experimentally observed ad is reported in references 1 to 5.
An investigation was conducted at the NACA Lewis laboratory to evaluate by experimental comparisons the effect of internal fins arid partitions on the anti-icing qualities of gas-heated airfoil sections, applicable to such components as turbojet-inlet guide vanes, support struts, propeller blades, and thin wings. Heat-transfer investigations were made in a two-dimensional duct tunnel on two designs of finned airfoil sections as compared with an unfinned section. Increases in airfoil surface temperatures above tunnel-air temperatures were measured for various rates of gas heating, for immersion in both dry and wet air streams, and at airspeeds up to 300 miles per hour. Because of simpler and more accurate experimental procedures, most of the data presented are for dry air. The results obtained for dry air were applied to anti-icing performance by use of the wet-air analysis given in reference 1. The three airfoil sections were analyzed to evaluate the important effects of heat conduction in the metal and the variations of convective heat-transfer rates in spanwise and chordwise directions. Surface-heating improvement factors are presented for two modified airfoil sections as compared with the original airfoil section.
APPARATUS AND AIRFOILS
Installation
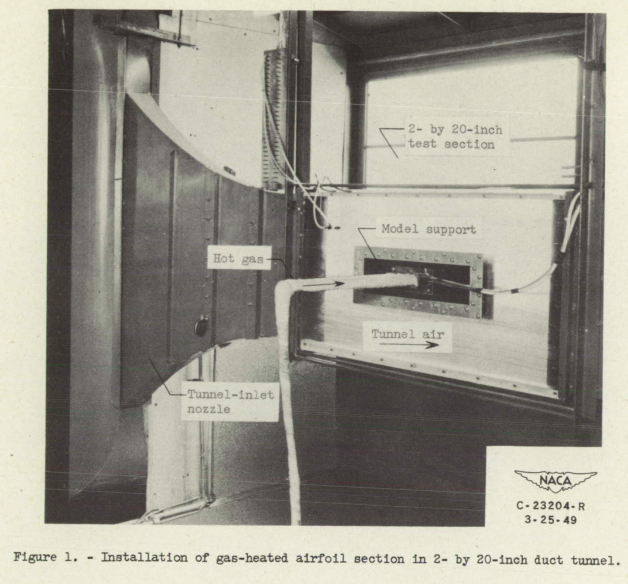
The duct tunnel used for the gas-heating investigations is shown in figure 1. Atmospheric air was induced through the tunnel by suction from a centrifugal blower. The transparent test section measured 2 by 20 inches.
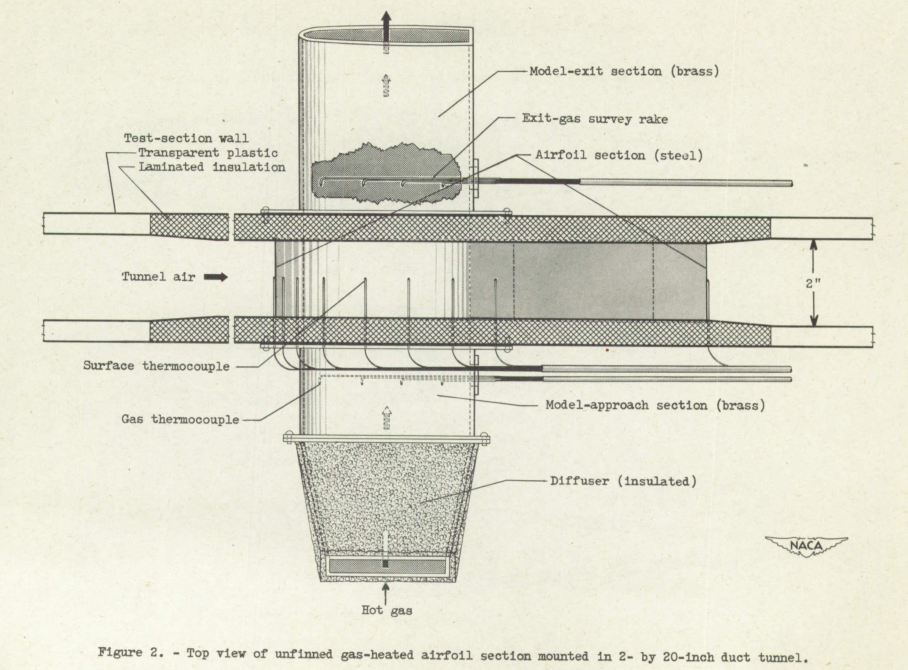
The airfoil sections were mounted in the center of the test section, as shown in figure 2. The hot-gas supply for the models was ducted through a rectangular diffuser, the approach section, the model airfoil section, and the exit section. Contours of the approach section, the exit section, arid the openings in the insulated side plates approximately matched the internal passage through the unfinned airfoil section. Small differences in the contours and slight misalinement of the assembly resulted, however, with attendant disturbances to the internal-flow boundary-layer characteristics. The hot gas was supplied from a compressed-air system and was piped through a calibrated orifice, a regulating valve, an electric heater, and then through a duct to the diffuser and the models.
Above-freezing cloud conditions were simulated in the tunnel by the use of a water-spray nozzle located at the tunnel inlet. Calibrations of the nozzle indicated that average cloud conditions at the tunnel center line just ahead of the models were approximately as follows: volume-median droplet diameter, 15 to 20 microns; liquid-water content at 275 miles per hour, 1.3 grams per cubic meter; liquid-water content at l00 miles per hour, 1.7 ams per cubic meter.
Airfoil sections
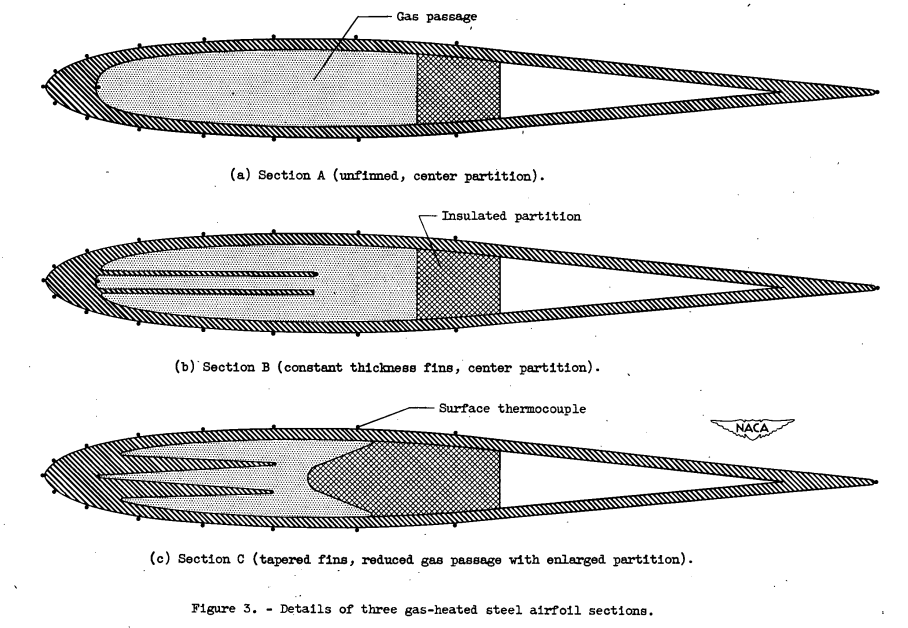
Details and dimensions of the three airfoil sections investigated are presented in figure 3 and table I. An NACA 0012 symmetrical airfoil section was selected for investigation because it is a basic shape about which other icing information is known and maybe considered somewhat representative of propeller-blade sections, struts, wings, and the fore part of turning vanes.

Airfoil section A is a hollow steel section with an Insulating partition starting at 0.46 chord. Section B is the sante as section A, with the addition of two sheet-metal fins that are attached to the leading edge. Section C has shorter and thicker fins that are tapered toward the tips and an enlarged center partition to reduce the gas- flow-passage area. When the airfoil Is assembled with the tunnel side walls, the hollow region behind the partition becomes a dead-air chamber.
Instrumentation
Surface-temperature thermocouples were installed on the sections in 16 locations (fig. 3). One metal temperature thermocouple was located at the leading edge of the internal passage of each section and one thermocouple was installed at the tip of one fin of both finned sections. The tunnel-air temperature was measured at the tunnel inlet and. two fixed gas-temperature rakes of four bare thermocouples each were located on the gas-passage center line (fig. 2).
Iron-constantan thermocouple junctions were spot-welded to the airfoil metal surfaces. The leads were rolled to a thickness of approximately 0.003 inch and attached to and insulated froth the metal by a thin coating of cement. Front the junctions, the leads extended to corresponding holes in the side wall (fig. 2).
The total protrusion of thermocouples and leads above the metal surface was approximately 0.007 inch. The installations were faired into the airfoil contour as inch as possible and an effort was made to keep the metal surfaces clean.
Inasmuch as all the models were symmetrical and at zero angle of attack, the upper and lower surface thermocouples yielded very. nearly the same temperature patterns and served as a check on the instrumentation.
PRELIMINARY CONSIDERATIONS
Thermocouple Attachment and Surface Coating
Gas-heated airfoils' are difficult to provide with accurate surface-temperature instrumentation. If the thermocouple junction and adjacent leads protrude into either the air or hot-gas stream, an appreciable error may be introduced by heat conduction along the leads. Projecting leads can also seriously disturb the stream-flow characteristics, such as causing transition to turbulent flow in the air stream and blockage to the gas-stream flow. Even if the thermocouple leads were fully embedded beneath the surface, their tunnels in the thin metal skin would still constitute heat barriers disruptive to the normal skin-temperature gradients. By simpler means, the instrumentation may be completely covered with a smooth surface coating, such as paint, that will minimize most of the aforementioned difficulties. Unfortunately, the temperature gradient through the surface coating is introduced as a new problem. Such a coating removes the thermocouple from the exposed surface and leaves doubt as to the actual surface temperature.
In order to obtain a measure of these surface-temperature errors, a preliminary comparison was made under the same flow and heating conditions between section A with bare instrumentation, as previously described, and with tie same instrumented section externally coated with aircraft primer and a final coat of black lacquer so that no surface irregularities remained. The paint thickness was approximately 0.010 inch, which was sufficient to cover the thermocouples by about 0.003 inch. This paint coating is similar in application to that of many propellers and wings in use and has also been used in previous icing investigations.
The effect of the paint coating is illustrated in figure 4, where the chordwise variation of surface-temperature rise above dry tunnel-air temperature is plotted for the bare .nd painted section A at two flow conditions. The painted airfoil indicated the higher surface temperatures; the greatest increase over the bare model occurred at the leading edge and at the highest values of gas flow and air velocity investigated. The greatest and smallest differences in stagnation-point temperatures between the two models were determined from data not shown as approximately 50° and 30° F, respectively. During icing conditions, however, calculations indicate that these differentials would be reduced to the order of 15° to 10° F.
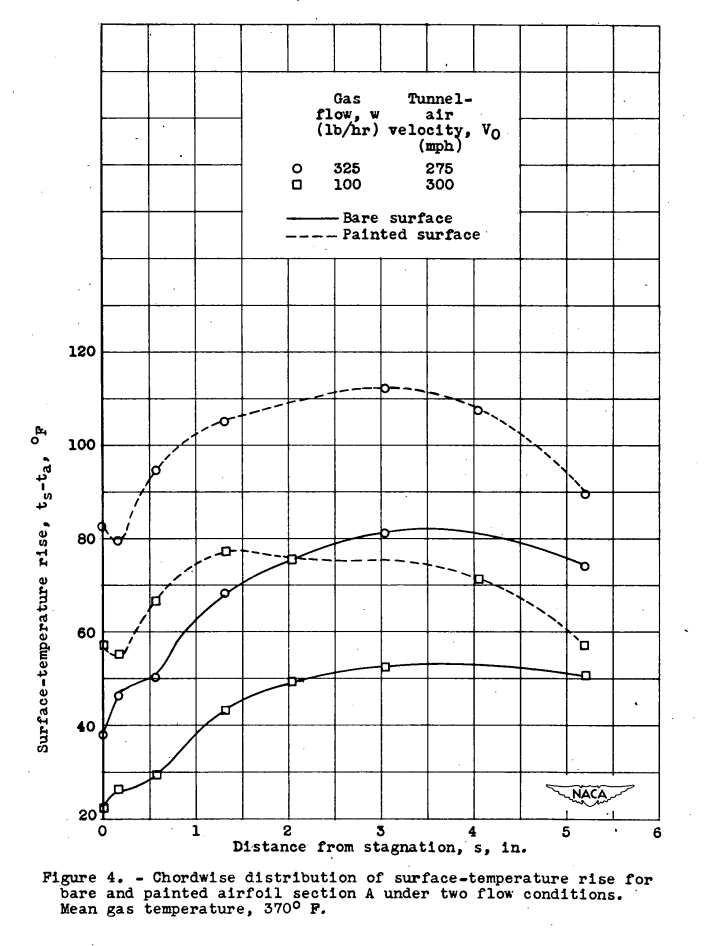
Because the maximum paint effect occurred at the leading edge, the gradient through the paint coating and the reduced conductive loss in the thermocouple leads were believed to account for most of the paint effect and the improved surface smoothness was of lesser importance. Thermal-conductivity values for paints are too uncertain to allow calculation of temperature gradients through paint films for known rates of heat transfer. The available information, however, indicates that more than half of the observed temperature increase with surface painting is due to the thermal gradient in the paint film and that the balance is caused by local thermocouple errors inherent in the bare surface-thermocouple installation.
These comparisons illustrate that thermocouples attached to a metal surface and covered with a faired coating of paint or cement will indicate temperatures several degrees higher than the exposed surface, which, for example, may be undergoing icing while safe anti-icing temperatures are being indicated. Thus, to insure conservative surface-temperature indication, the bare surface-thermocouple installation was employed in this investigation, with care taken that the leads were rolled as fine (0.003 in. thick) as durability considerations permitted.
Datum Air Temperature
The local kinetic, or datum air, temperature ta over the models in the dry-air investigations was taken as the constant value indicated by the static-air-temperature thermocouple at the tunnel inlet. (All synbols used throughout this report are defined in the appendix.) This simplification avoids calculation of adiabatic temperature drops, local velocities, and kinetic-recovery coefficients. For the range of airspeeds involved, this approximation may entail a maximum theoretical error of 3° F. For an experimental check on the kinetic heating effect, the models were subjected to the maximum air velocity Vo of 300 miles per hour with zero gas flow. The surface thermocouples indicated temperatures within 1° F and the tunnel-inlet thermocouple indicated a maximum disagreement of 1 1/2° F with the average model-surface temperature. By considering the magnitude of the surface-temperature-rise differentials that usually resulted in the investigations, this approximation of air temperature was deemed satisfactory for all cases.
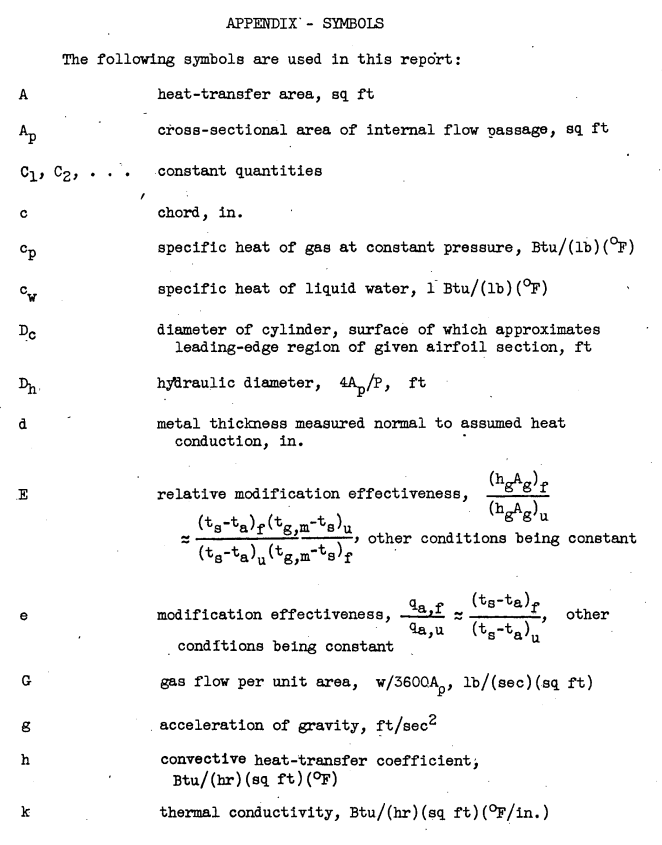
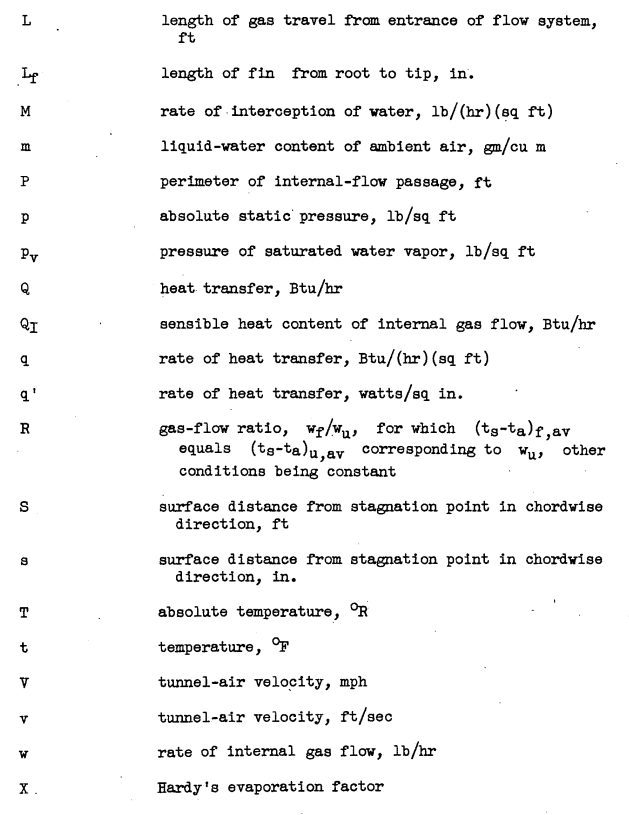
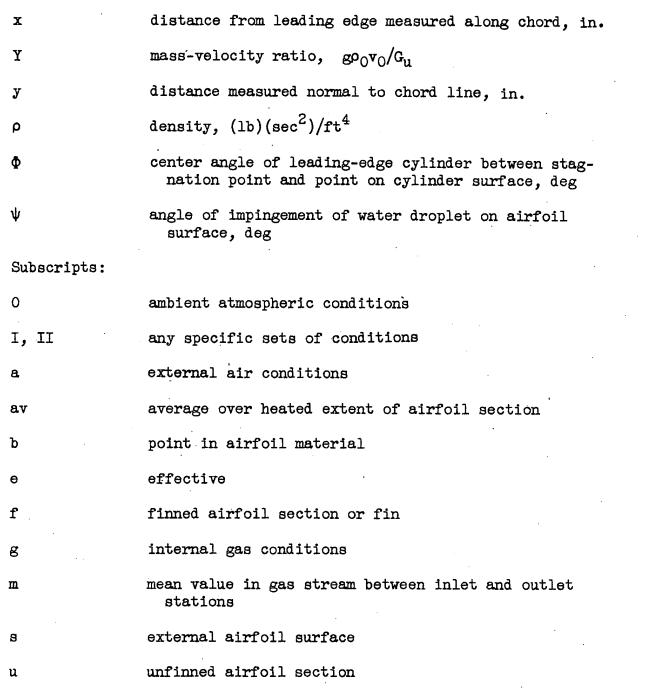
The preceding discussion applies equally well to the effective gas temperatures, as indicated by the gas-temperature probes, because of the relatively low maximum gas velocity (110 mph) and negligible amounts of radiation at the operating temperatures.
In the few vet-air investigations, the datum air temperature ta in the spray cloud was determined from a calibration of unheated model temperatures taken over a range of air velocities, liquid-water contents, and dry-air temperatures at the tunnel inlet. No measurements of the tunnel-air humidity were made during the calibration; consequently, the datum temperatures In the wet-air investigations were less reliable than in the dry-air cases.
The trailing-edge surface temperatures have not been plotted in the subsequent figures. The trailing half of each section exhibited a rapidly decreasing surface temperature, which at the trailing edge approached the datum air temperature to within a maximum difference of 35° F (section C, gas flow of 325 lb/hr and air velocity of 102 mph).
Conduction Losses
Because of the narrowness of the duct tunnel, thermal conduction from the heated region of the models to the insulated side supports and the trailing half of the models was suspected of influencing the temperature indication at the model center lines. A "no-load" investigation indicated that the losses due to conduction into the side walls appreciably affected the surface-temperature indication. A thorough calibration was not made, however, and the indicated values of surface temperature are presented in the subsequent analysis. The error involved is greatest at the low air velocities and regions near the midpoint of chord; neither case is critical to anti-icing performance.
CONDITIONS AND PROCEDURE
The airfoil-surface-temperature patterns over each of the three models were obtained in dry tunnel air at velocities V0 of 102, 160, 210, and 275 miles per hour, gas-flow rates w of 100 and 325 pounds per hour, and a mean gas temperature tgm of 37Q0 F. Surface temperatures were also taken in dry air at a velocity of 300 miles per hour with gas flows of 100, 150, 240, and 325 pounds per hour through each of the sections and with the samè mean gas temperature. In order to determine the effect of gas temperature, surface temperatures of each section were obtained in dry air at a velocity of 102 miles per hour for a range of mean gas temperatures from 125° to 375° F. The datum air temperature ranged between 32° and 80° F.
For the aforementioned conditions and throughout the heat-transfer analysis and discussion, dry tunnel-air conditions are presented. Only a few comparisons are made with wet-air conditions in the tunnel to afford a check on the analysis of anti-icing heat requirements. Wet-surface temperatures over the three airfoil sections were taken at tunnel-air velocities of 102 and 275 miles per hour with gas flows of both 100 and 325 pounds per hour. Wet datum ar temperatures were obtained between 350 and 630 F.
Steady-state flow was established for each condition by allowing at least 10 minutes between any significant change in flow or temperature values and the recording of data. Consistency of the data was good, with reruns of the same conditions agreeing within an average discrepancy in surface temperature of 30° F. The recording potentiometer was considered accurate to within 2° F.
ANALYSIS OF RESULTS
Typical Results
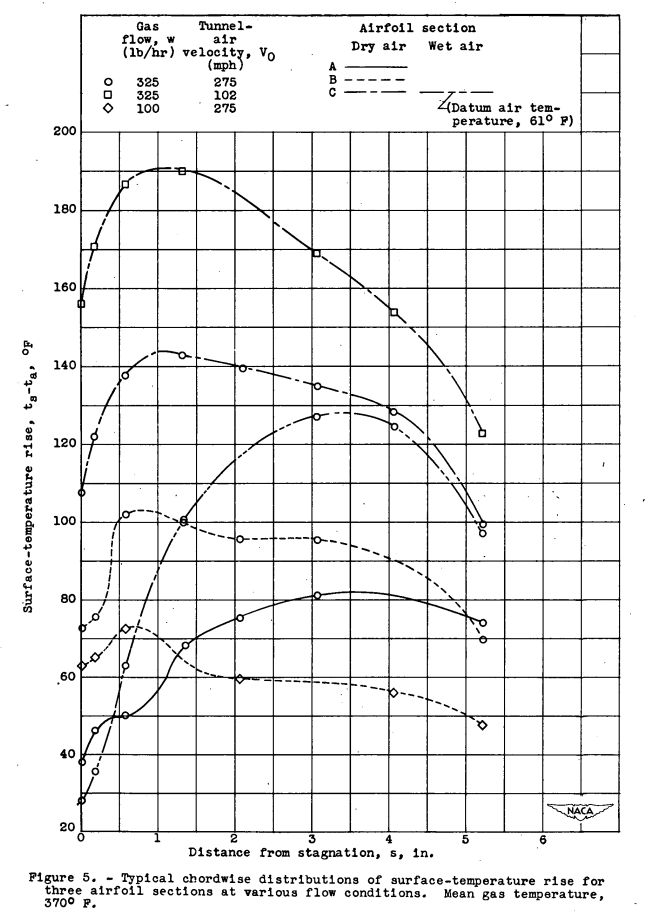
The rise in surface temperature above the datum air temperature for the three airfoil sections at various flow conditions Is shown in figure 5.
Comparisons may be made directly among the following conditions:
(a) airfoil sections A, B, and C with the same heating and flow conditions in which the increased surface heating due to internal fins and partitions is clearly evident;
(b) section C with air velocities of 275 and 102 miles per hour but with the same gas-flow rate and temperature, illustrating the magnitude of air-velocity effect;
(c) section B with gas flows of 325 and 100 pounds per hour and the same air velocity and gas temperature; and
(d) section C with dry and wet tunnel air and the sane heating and flow rates.
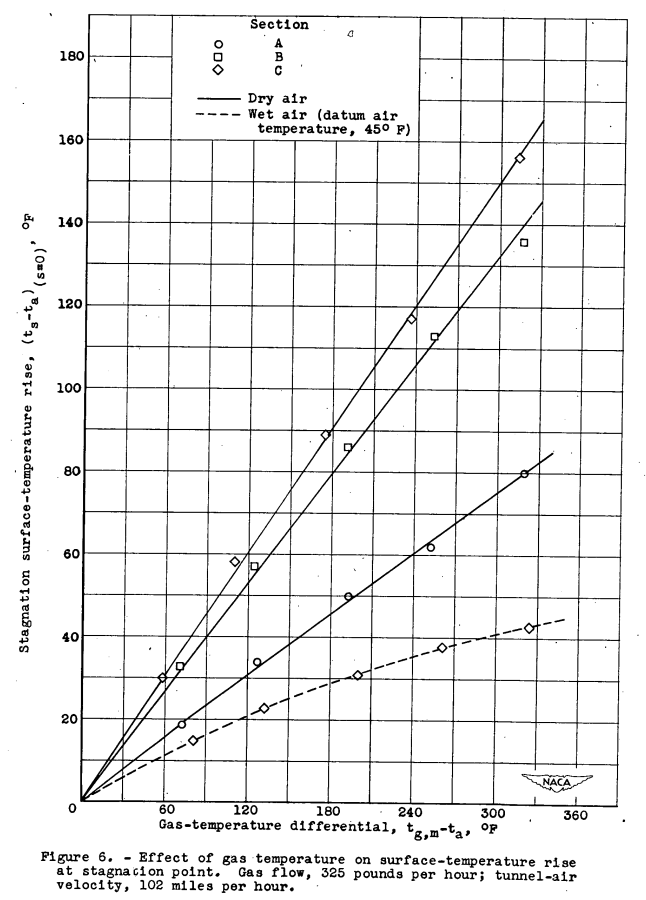
Comparison (d) shows that the airfoil leading edge in cloud conditions was considerably chilled by evaporation of impinging moisture but the surface became effectively dry at approximately 3.5 inches from stagnation and the two surface-temperature curves very nearly coincided beyond that point.The surface-temperature rise at the stagnation point of the three airfoil sections as a function of the gas-temperature differential tg,m - ta is shown in figure 6. Data are presented for section C in both dry- and wet-air conditions. This figure confirms the expected linear relation between gas temperature and surface temperature, other conditions being constant, and indicates the consistency and reliability of the installation and the instrumentation used. The three dry-air examples show data points scattered less that ±5 percent from the plotted straight lines. The wet-air curve indicates the progressive reduction in surface-temperature rise for increments of increasing gas-temperature differential, caused by the dependence of surface-evaporation rate on actual surface temperatures.
Effectiveness of Internal Fins and Partitions
The effectiveness of gas-heated airfoils with internal-fin modifications in anti-icing can be measured by comparing, under the same conditions, a finned section with an unfinned section in regard to (a) increased surface heating rates and (b) reduced heated-gas requirements. With fins, the increase of the surface heat-transfer rate for a fixed condition of air and gas flows can be determined from the surface-temperature rise above the datum air temperature tsta because in dry air the heat-transfer coéf- ficient is nearly constant over the normal range of temperatures. Thus,
qa = ha(ts - ta) ~= C1(ts - ta) (1)
Similarly, with fins, the decrease in the required heat content of the internal gas flow for a fixed condition of blade-surface heat transfer can be determined from the gas-flow rate if the mean gas temperature is held constant, or
Qi = w cp(tg,m-ta) = C2 w (2)Modification effectiveness. - If equation (1) is considered, a comparison of surface heat transfer between finned and unfinned airfoil sections can be expressed by the ratio
(qa,f / qa,u) = e ~= (ts-ta)f / (ts-ta)u (3)that may be termed modification effectiveness. The chordwise variation of local modification effectiveness, as indicated for the finned sections B and C, is plotted in figure 7 for various flow conditions. The increased heat transfer through finned sections was marked. In each case, the improvement was greatest in the region of the stagnation point, the area most critical for anti-icing of gas-heated airfoils. The increase in surface heat transfer, denoted by e, reached a maximum of 3.5 at the leading edge of section C. The increase at the stagnation point was from 30 to 80 percent greater than for the average of the whole heated-surface area. The fin design of section C was always more effective in increasing surface heat transfer than was section B.
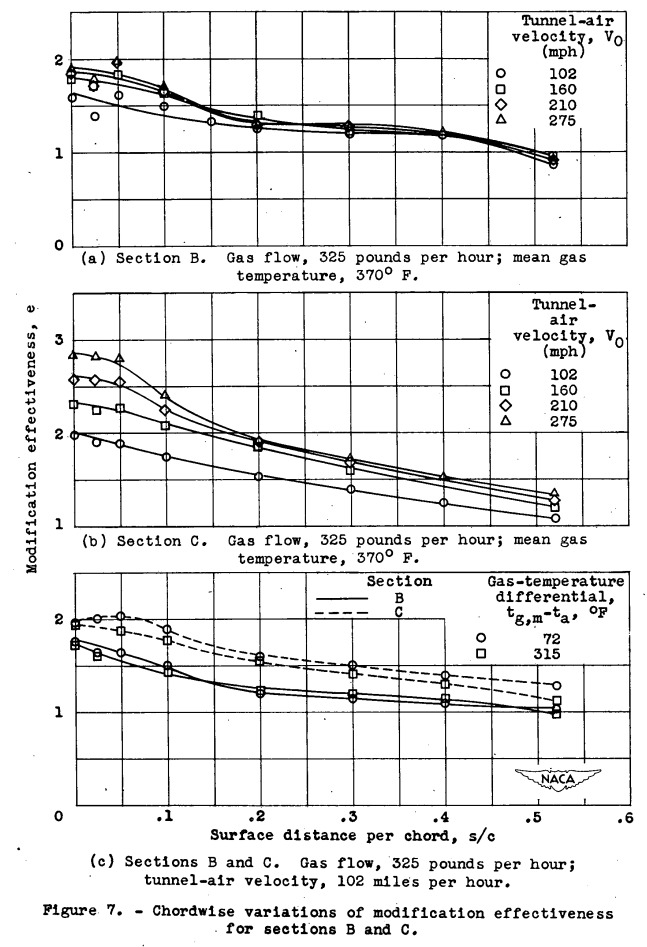
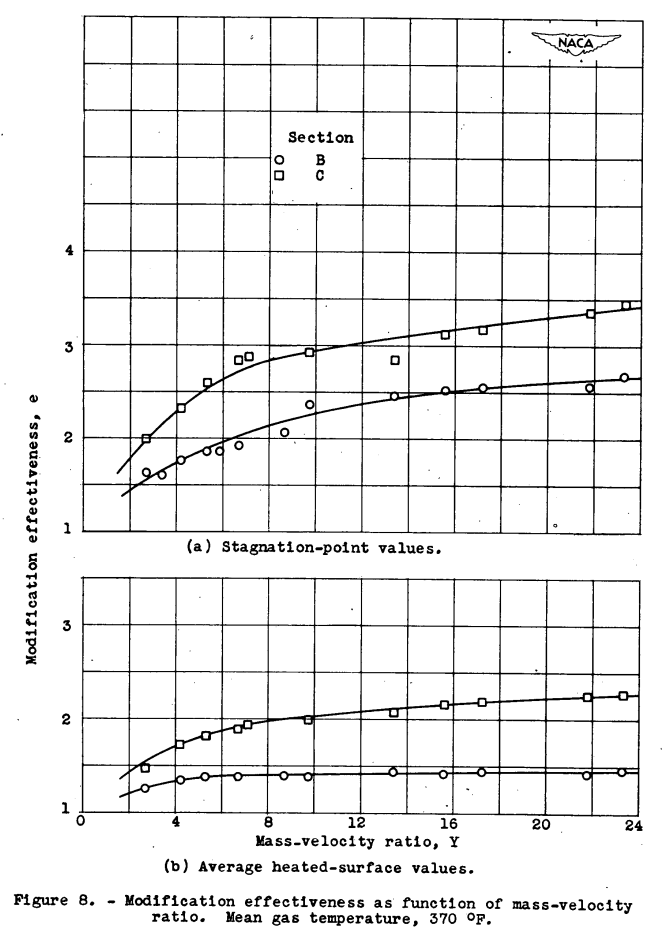
Inspection of the variables involved in figure 7 shows that modification effectiveness increased with air velocity, decreased with increasing gas flow, and was substantially independent of the gas-temperature differential tgm - ta. Accordingly, the modification effectiveness was investigated as a function of the external to internal flow ratio v/w and correlated well when plotted as a function of the nondimensional mass-velocity ratio g ρ0 v0 / Gu = Y (fig. 8). The improvement in surface heat transfer due to the addition of the internal configurations investigated for sections B and C is also shown in figure 8.
Relative modification effectiveness. - Another concept of modification effectiveness, a comparison of the internal effective conductance hg Ag between modified and unmodified airfoil sections, may also be applied. The effective conductance of heat from the gas stream to internally convoluted airfoil sections cannot be easily determined by theoretical means but can be experimentally determined by its external effects. For simplicity, a negligible temperature gradient is assumed in the heat-flow path across the airfoil skin material in the following equations; in some cases, however, the gradient has an appreciable effect as will be subsequently shown:
Qg = hg Ag (tg,m -ts)av (4)
Also,
Qa = ha,av Aa (ta -ts)av (5)
Assuming no spanwise conduction and no chordwise conduction except within the heated area gives
Qg = Qa (6)
and
hg Ag = ha,av Aa (ts- ta)av / (tg,m -ts)av (7)
or
(hg Ag)f / (hg Ag)u = (ha,av Aa)f (ts- ta)av,f (tg,m -ts)av,u / [ (ha,av Aa)u (ts- ta)av,u (tg,m -ts)av,f ] (8)
Furthermore, the following equation is given in reference 6 for fully developed turbulent flow in long tubes:
hg =4.1x1O^-4 T g,m^0.3 w^0.8 p^0.2 / Ap (9)
From reference 7, for laminar air flow over plates,
ha = 0.0562 (Ts + Ta)/2)^0.5 (vav ρ0 g / s)^0.5 (10)
for air flow normal to the leading-edge cylinder,
ha = 0.194 (Ts + Ta)/2)^0.49 (g ρ0 v0 / Dc)^0.5 (1 - abs(Φ/90)^3) (11)
and for turbulent flow over plates,
ha = 0.524 (Ts + Ta)/2)^0.49 (g ρ0 vav / s^0.25)^0.5 (12)
From equations (8) and (10) to (12), the external effective conductance ha,av Aa is seen to be essentially constant between finned and unfinned airfoil sections compared at the same flow conditions. The slight dependence of ha on ts is unimportant and is neglected in these calculations. Accordingly, equation (8) reduces to
(hg Ag)f / (hg Ag)u = E ~= (ts- ta)av,f (tg,m -ts)av,u / [ (ts- ta)av,u (tg,m -ts)av,f ] (13)
The factor E in equation (13) can thus be determined as the surface-average modification effectiveness e 7 multiplied by the unfinned-to-finned-section ratio of the gas-to-surface temperature differential (tg,m - ts)av. With the factor E, data taken at different values of gas temperature can be related on a common basis. The data in figure 8 are replotted in terms of the factor E in figure 9. The values of E at the stagnation point were calculated using equations (4) to (6) and (13) for point values as was done, for integrated averages over the heated-surface area.
The curves for the heated-surface averages In figure 9 approach constancy with the mass-velocity ratio Y. The variation of E with Y is due to the temperature gradient through the metal skin, which was neglected in the derivation of E. The greatest variation is in the curves for the stagnation-point values, resulting from the large leading-edge temperature gradients.
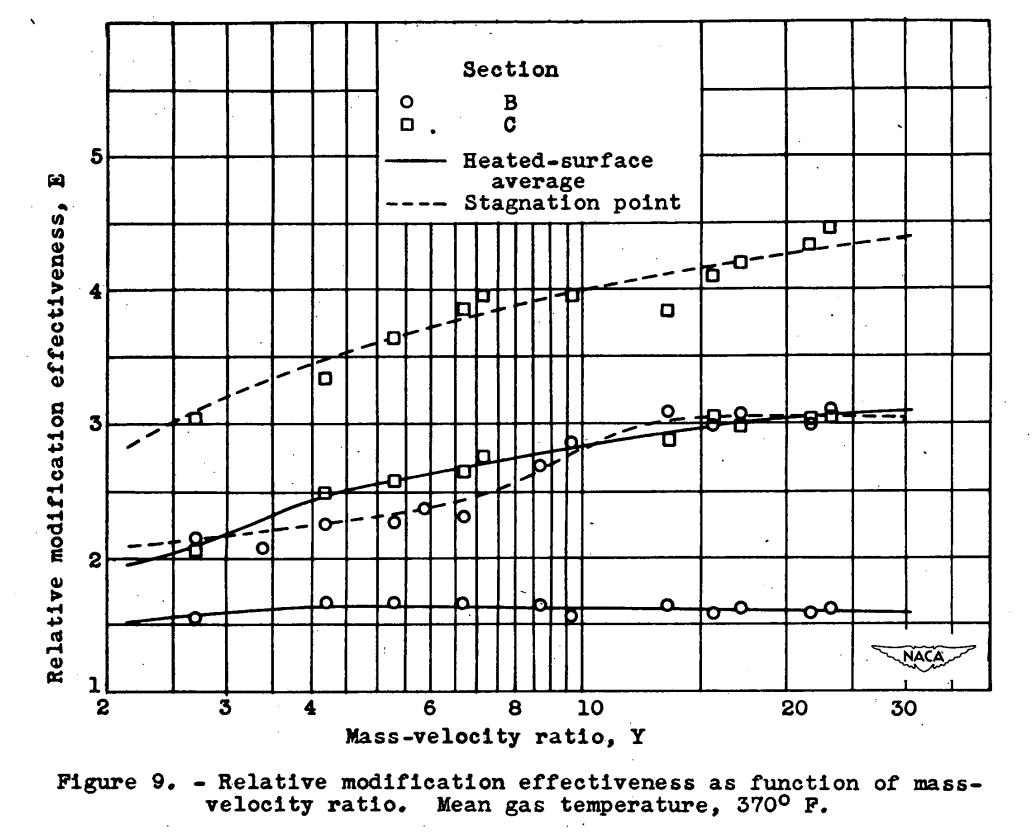
Representative values of the factor E, based on typical operating flow conditions, may be taken as constants over the flow ranges to be expected.
...
Heat Transfer in Finned Leading Edge
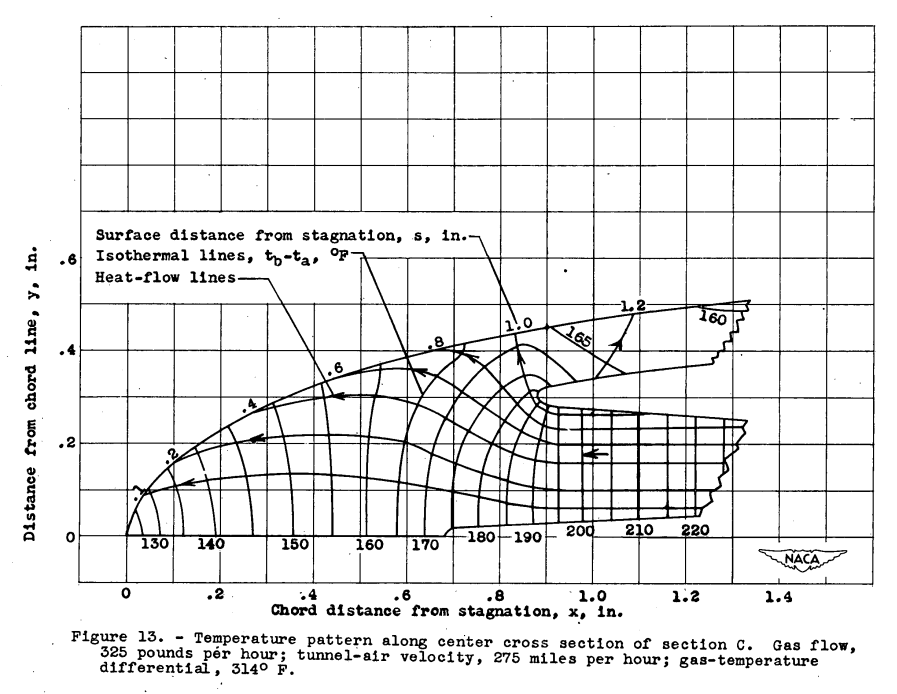
The chordwise distribution of temperature and heat transfer in the leading-edge region of finned airfoil section C has been determined for the following conditions: gas flow, 325 pounds per hour; tunnel-air velocity, 275 miles per hour; and gas-temperature differential, 314° F. The temperature gradient through the tapered fin was found from a series of incremental heat-transmission calculations beginning at the known fin-tip temperature and by utilizing the indicated gas-temperature profile as well as the theoretical gas-film heat-transfer coefficient. The relaxation method presented in reference 12 was used for the fore part of section C to obtain the isotherms shown in figure 13. The external air heat-transfer coefficient determined from the development in figure 13 agreed approximately with the theoretical ha (equations (10) and (11)). The heat-flow channels illustrate how the leading-edge fins increase the heat transfer and temperature at the critical stagnation region. Half of the heat flow in the tapered fins is directed into the first 3/8 inch of the airfoil surface.
"reference 12" is
- Emmons, Howard W.: The Numerical Solution of Partial Differential Equations. Quart. Appi. Math., vol. II, no. 3, Oct. 1944, pp. 173-195.
Conclusions
From an investigation of three gas-heated airfoils, one hollow and two modified with internal fins and partitions for improving anti-icing heat-transfer characteristics, the following results were obtained:
1. The local surface-heating rate for ice prevention on gas-heated airfoils was increased up to 3.5 times by the addition of metal fins attached at the leading edge of the internal gas passage, which was also reduced in area.
2. The surface-heating increase in dry-air flow was from 30 to 80 percent greater at the stagnation point than for the average over the entire heated area of the airfoil sections investigated. The greatest increase in surface heating was obtained with relatively thick tapered fins and with a gas-passage restricting partition.
3. Over the range of air and gas flows investigated, the relative modification effectiveness, defined as the ratio of internal effective conductance between the modified and unmodified airfoil sections, was approximately as follows.
4. Rates of hot-gas flow through the original unfinned airfoil section were reduced approximately 64 and 86 percent by the addition of constant-thickness or tapered fins, respectively, when the total heat transfer through the heated-surface area was constant.
5. At a gas flow of 325 pounds per hour, a gas-temperature differential of 310° F, and an air velocity of 275 miles per hour, the magnitude of surface heat transfer in the stagnation regions was approximately as follows. For the tapered-finned section, this heating rate represented a surface-temperature rise in severe icing conditions of approximately 57° F above a wet datum-air temperature of 0° F.
6. For the flow, heating, arid icing conditions presented in the previous paragraph, the temperature drop through a 0.010-inch- thick surface paint coating on the leading edge of the unfinned section was calculated to range from 10° to 15° F.
7. Fins and partitions in the flow passage of gas-heated airfoils had multiple effects in increasing the local surface heat-transfer rates and in creating design variables that permit more effective control over the chordal and spanwise distribution of heat flow.Relative modification effectiveness
| Airfoils section | Heated-surface average | Stagnation point |
|---|---|---|
| Constant thickness fins, center partition | 1.6 | 2.4 |
| Tapered fins, reduced gas-flow passage | 2.6 | 3.7 |
| Airfoil section | Rate of surface heat transfer in stagnation region, (watts/sq in.) |
|---|---|
| Unmodified | 10 |
| Constant-thickness finned | 17 |
| Tapered finned | 27 |
Citations
NACA-TN-2126 is cited by four publications, per scholar.google.com.
Related
This is part of the Engine Inlet Icing Thread.
Notes
-
Gray, Vernon H.: Improvements in Heat Transfer for Anti-Icing of Gas-Heated Airfoils with Internal Fins and Partitions. NACA-TN-2126, 1950. ntrs.nasa.gov ↩