"very few supercooled droplets exist at temperatures lower than -35° C and the existence of an icing cloud at such low temperatures is probably an unusual occurrence."
"Statistical Explanation of Spontaneous Freezing of Water Droplets" 1
Abstract
A statistical theory based on the presence of small crystallization nuclei suspended in water is developed, to explain experimental results showing that on the average small droplets can be supercooled. to lower temperatures than large ones. Small nuclei of crystallization are assumed responsible for causing supercooled water to freeze spontaneously.
The average behavior of supercooled droplets is reproduced on the basis of probability theory with an assumed distribution of crystallization nuclei with respect to the temperatures at which the nuclei cause freezing. The most probable distribution curves of spontaneous freezing temperatures for water droplets of various sizes within the size range found in clouds are obtained.
Discussion
In this study, data from the previously reviewed NACA-TN-2142 (reference 2 below) was used to seed a statistical model of the freezing temperature of drops based on the mote (small particle) theory of initiating freezing. An approximate correspondence of theory to test data is found, with several caveats noted.
INTRODUCTION
The prolonged operation of unprotected. aircraft in supercooled clouds has been found to be a hazard. For the icing hazard to be overcome, the physical conditions under which supercooled clouds exist must be understood. The physics of supercooling and freezing is incompletely understood, as shown by conflicting opinions expressed in the literature. The following factors have been described as causes of freezing in supercooled. water samples:
(1) introduction of ice crystal;
(2) mechanical shock, such as vibration, scratching of solid surfaces together in water sample, and sound waves;
(3) length of time water has existed in supercooled state;
(4) impurities; and
(5) droplet size.Investigators seem to agree that an ice crystal introduced into a sample of supercooled. water will cause the water to freeze. Recent experiments by Dorsey (reference 1) indicate that mechanical shock, however, is of little importance in freezing of supercooled. water; like- wise, time apparently is not a factor. From the extensive investigation of reference 1, it is concluded that small solid particles suspended in the water or irregularities on the container surface cause the supercooled water to freeze at a given temperature. These hypothetical particles are called motes and the temperature at which a sample freezes without any apparent external stimuli is called the spontaneous freezing temperature. The spontaneous freezing temperature was found in most cases to be a characteristic of each sample, which led to the mote hypothesis.
The observations described in reference 1 have been substantiated somewhat in reference 2 in which a statistical investigation of water-droplet size as a factor in determining the spontaneous freezing temperatures of the droplets is presented. By observation of a large number of droplets, the following results were obtained: (1) The frequency- distribution curve with respect to spontaneous freezing temperature of a given droplet size was found to have a marked peak or mode; and (2) the average spontaneous freezing temperature of each size group decreased with decreasing droplet size.
THEORY
An assumption is made that a large number of motes are present in liquid water. Also, each mote is assumed to be associated, with a definite spontaneous freezing temperature. The freezing temperature of a water sample is governed by the mote in the sample that is associated. with the highest freezing temperature.
In the experiment reported in reference 2, water was condensed from the atmosphere in the form of frost on a polished metal surface by lowering its temperature to approximately 35 C. The frost was subsequently melted and droplets formed on the surface. Repeated application of this procedure made a large number of droplets of various sizes available for determining spontaneous freezing temperatures. Because the water condensed from the atmosphere was a very small fraction of the total amount of water available in the form of vapor, the process was practically the same as drawing small samples of volume V from a large reservoir of liquid water of volume V. Because motes of all kinds are assumed to be present everywhere, it is reasonable to consider them to be present in the same relative proportions in the hypothetical volume of liquid water V.
The problem to be solved is the determination of the most probable frequency-distribution curve of spontaneous freezing temperatures subject to the following conditions:
(1) There are N 0 , N1 , N2 , N3 , . . . N, . . . motes of kinds 0, 1, 2, 3, . . . T, . . ., respectively, present In the volume V, where T Is the absolute value of the temperature In 0C at which the mote of kind. T causes water to freeze.
(2) The small volumes that are drawn from V are of volume V, and the total number of volumes V obtainable from V is v/Δv = μ.
(3) The number of draws In each set of draws from V is so small that μ is practically unchanged while a set is being drawn....
The extensive mathematical model contained in the publication is not detailed herein. We will discuss the results and conclusions.
RESULTS AND DISCUSSION
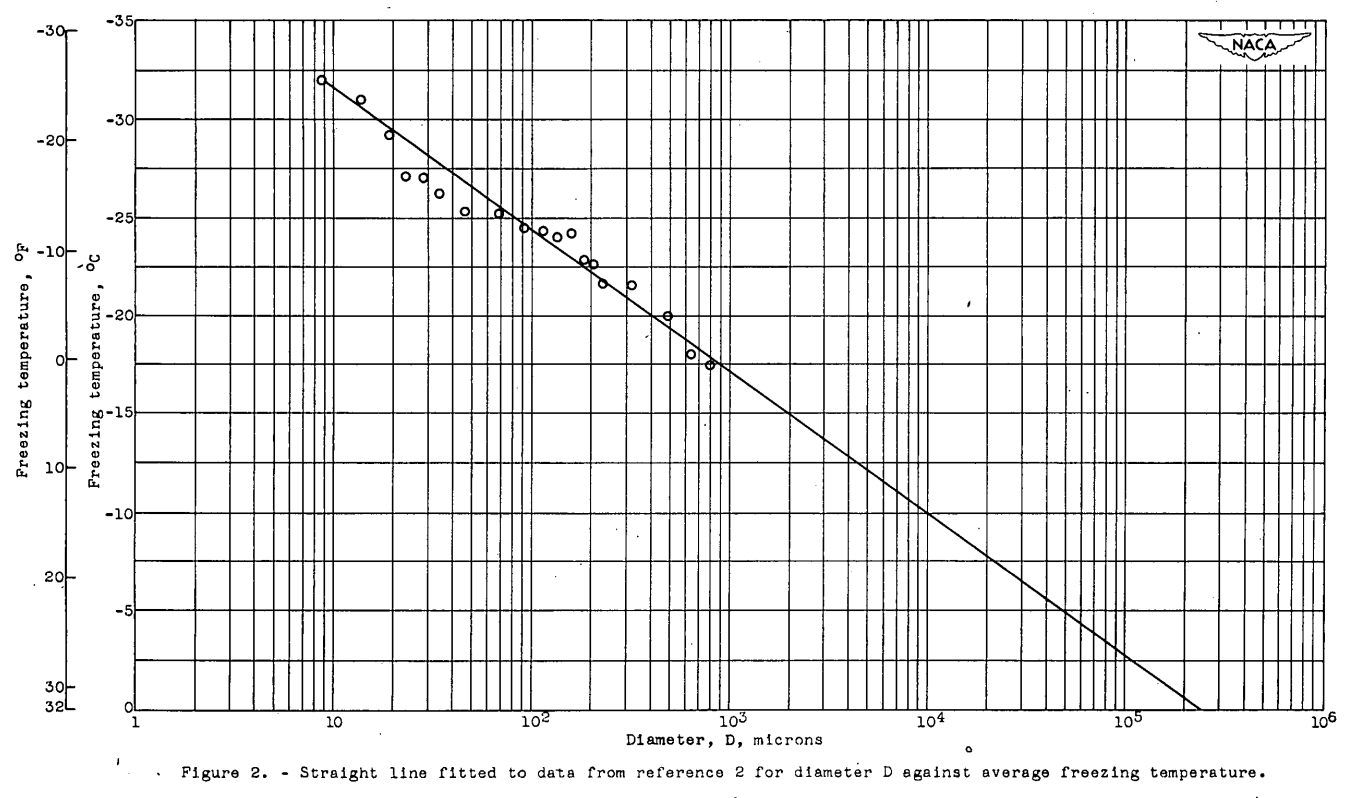
For comparison of the theory of this, report with the experimental results of reference 2, the data of reference 2 for the average freezing temperature-size curve are replotted on semilog paper, and an irregular curve that can be fitted reasonably well with a straight line is obtained. (fig. 2). This result agrees with the linear relation between TM and log D indicated by equation (7). The slope of the straight line, as drawn in figure 2, is -7.21 and the value of D0 is 24 (cm). From the slope, the value r is found by equation (8) to be 2.60 and, from the intercept D0 and equation (9), ρ0 has the value 2.64x10⁻⁴ (cm-3). The linear equation that best fits the data of reference 2 is therefore TM = 9.95-7.21 log D.
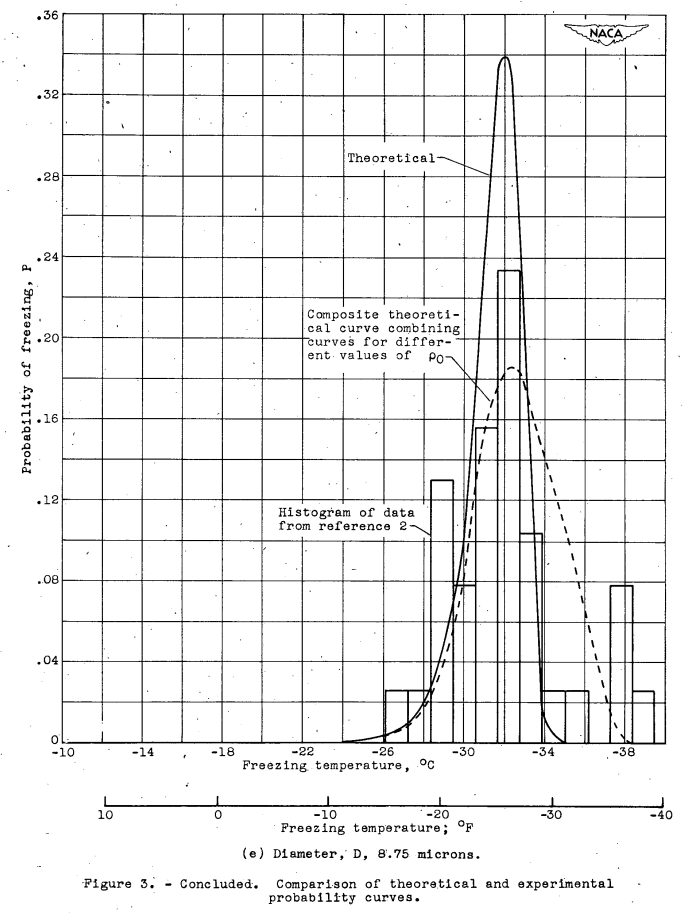
With the constants r and ρ0 now known, it is possible to compute the probability curves for various droplet sizes. A comparison between these curves and the corresponding experimental frequency- distribution curves of reference 2 is given in figure 3 where histograms of the experimental data are reduced. to the probability scale. Figures 3(b) to 3(d) represent the results obtained for the droplet sizes with the greatest amount of experimental data, and figures 3(a) and 3(e) represent the results for the extremes of the size range investigated. where the data were limited. In the computation of the probability curves of figure 3, a convenient value of V = 10^5 (cm^3) was assumed. The value of V does not influence the curves if it is large compared. with ΔV.
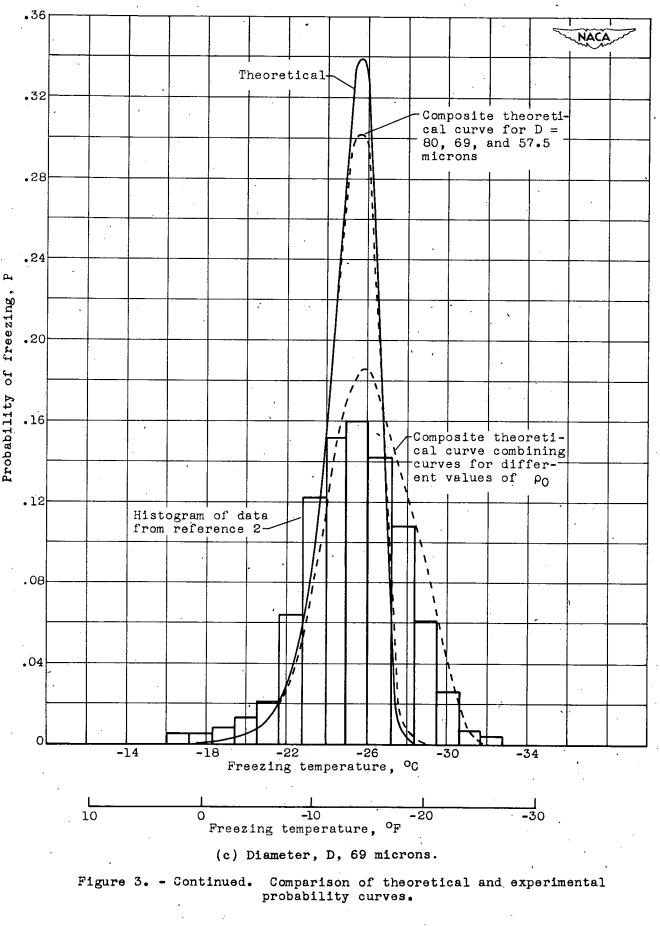
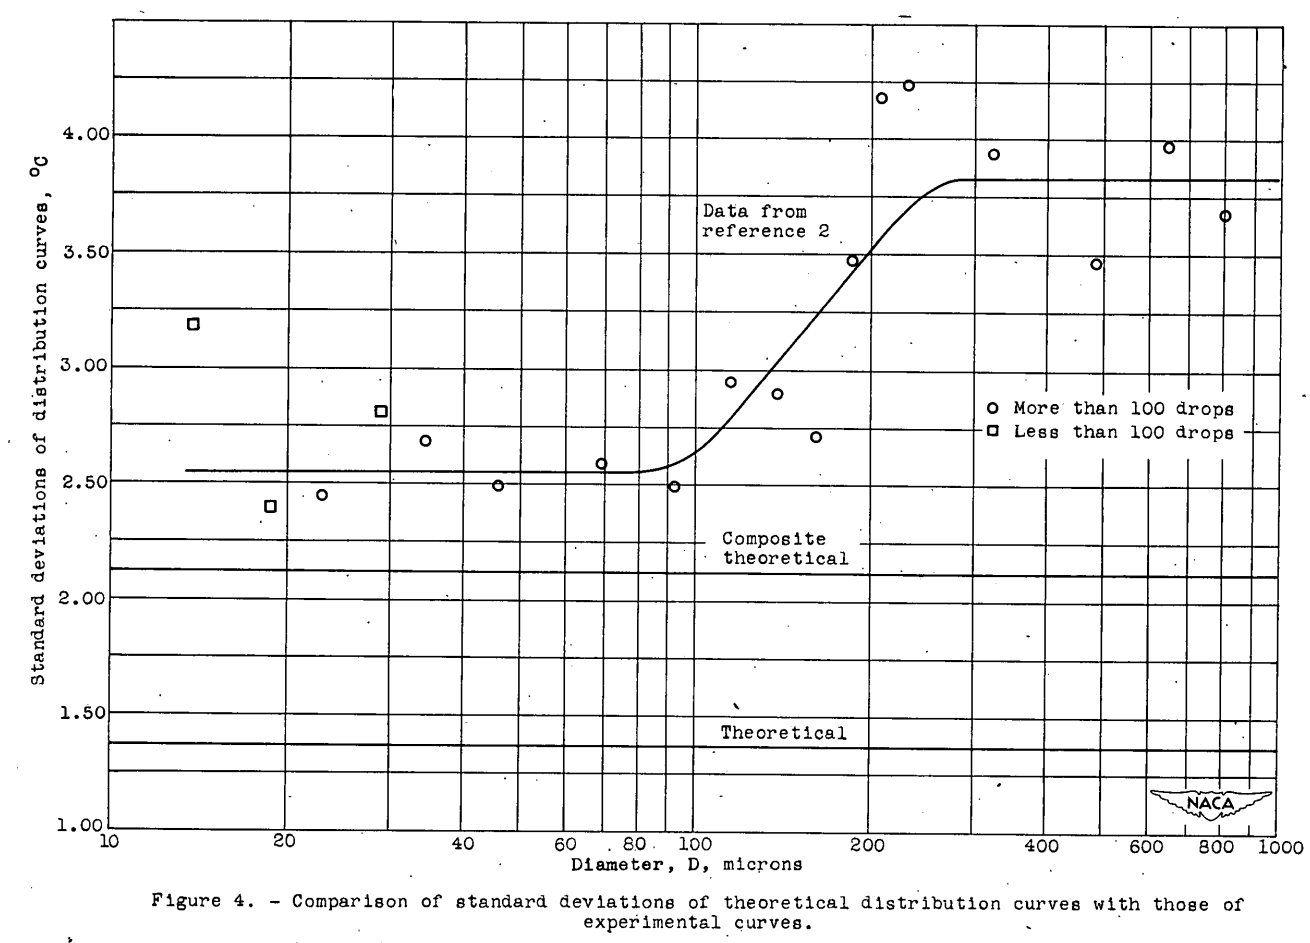
The agreement between the theoretical and experimental curves in figure 3 is qualitatively very good, but the following differences in detail exist. The modes of the theoretical curves differ from those of the experimental curves corresponding to the deviation of experimental points from the straight line drawn through them in figure 2. The experimental probability curves are broader and have less pronounced. peaks than the theoretical curves. The standard deviations (root mean squares of the deviations from the mean freezing temperature) of the theoretical curves are constant and equal to 1.38° C, but the standard deviations of the experimental curves are between 2 and 4 times as great and are roughly constant in the size range below 100 microns (fig. 4). Above 100 microns there is a sharp increase in the standard deviation of the experimental data to a higher approximately constant value of 3.8.
The foregoing difference between the experimental and theoretical curves cannot be ascribed to the fact that the experimental data are grouped into narrow droplet-size ranges to provide the freezing- temperature distribution curves for a given average droplet size. A composite theoretical curve formed by combining theoretical curves from the middle and the two extremes of the experimental-size group differed very little from the unmodified theoretical curve, as shown in figure 3(c).
Better agreement between theory and experiment is obtained if several different mote-density functions are postulated and. the corresponding theoretical curves combined. This procedure may be justified, because the experimental data were taken on several days distributed over a period of three months. Data taken each day covered almost the entire range of droplet sizes investigated. If impurities were the active agent, the mote-density function could change from day to day during that time. Thus, the combination of data taken at different times could easily broaden the experimental distribution curves as compared to the theoretical curves. Changes in r and ρ0 could modify the slope and. the intercept, respectively, of the TM - log D curve (fig. 2).
The modes of the theoretical distribution curves may be shifted without changing the slope of the TM -log D curve by varying the constant ρ0. The weighted combination of several curves corresponding to values of ρ0 between 10-5 and 10-3 (cm-3) (see table II) results In theoretical curves that fit the experimental curves much better than the unmodified theory, as shown in figure 3. The modified theoretical curves, however, have a constant standard deviation equal to 2.12° C, which still does not agree with the standard deviations of the experimental curves, as shown in figure 4. Better agreement might have been obtained by varying the values of r as well as of ρ0; but the additional work involved in varying r was not considered worthwhile, because the variation of ρ0 was only postulated to demonstrate the plausibility of the hypothesis concerning the behavior of the experimental standard deviations. The good agreement obtained between theory and. experiment indicates that variation of the mote-density function among several groups of combined, data can account for the discrepancy between theory and experiment.
Deviations from the most probable curves may by chance occur in the observed distribution curves, but deviations of a given magnitude become less probable as the number of observations increases. This principle is illustrated by the greater regularity of distribution curves based on a large munber of observed droplets as compared with those based on a small number of droplets. For example, the curves in figures 3(a) and. 3(e) for which 39 and 35 droplets, respectively, were observed are quite irregular as compared with the curve in figure 3(c), for which 692 drop- lets were observed.
CONCLUDING REMARKS
In the derivation of the foregoing statistical theory, emphasis has been placed on the mote hypothesis of Dorsey, but the theory is also applicable to homogeneous nucleation as described by Volmer (reference 6). According to reference 6, the random small-scale fluctuations in an impurity-free supercooled liquid may cause crystal nuclei to form, resulting in crystal growth from the mother liquid. The presence of motes in the liquid would mask the homogeneous nucleation. If it were possible to remove all foreign nuclei, then the mote distribution function NT would merely be renamed the homogeneous nucleus distribution function and. the logic of the theory in this report would apply as in the case of the motes except that NT would now be a function increasing with time. Thus, a container of liquid kept at a constant temperature of supercooling should freeze after a period of time. But the experience that Dorsey (reference 1) had in maintaining three test tubes at a temperature between -8.0° and -10.3° C for 312 days might seem to invalidate the homogeneous-nucleation theory. The apparent inconsistency that exists between the results of reference 1 and those expected from the homogeneous-nucleation theory may possibly be resolved, by the following logic. The temperature range in which the experiment of reference 1 was performed may be one of low nucleus-formation probability even over a period of 312 days. But if the probability of nucleus formation increases very rapidly at some temperature much lower than -10° C, the most probable length of time that a given water sample can remain at a low constant temperature of supercooling may be sufficiently reduced to make maintenance of the water sample in the supercooled state for a very long time practically impossible.
If the spontaneous freezing temperatures of droplets are principally determined by the presence of motes, the results of this report can be extended to supercooled clouds, because there should be no essential difference between the droplets supported on a surface and the droplets suspended in the atmosphere except for possible variations in the mote distribution curves as a function of time and place. The results of this report indicate that no well-defined temperature exists at which supercooled cloud droplets are transformed into ice particles. As the temperature is decreased in a given cloud, more and more droplets will tend to freeze until a point is reached at which very few droplets are left unfrozen. For example, in a cloud, of uniform droplet size with hemispherical diameter D of 34.5 microns or an actual spherical droplet diameter of 27.4 microns which is fairly common in clouds, practically all the droplets would be frozen at a temperature of -34° C.
On the other hand, practically all the droplets in the cloud would remain unfrozen down to a temperature of -18° C and only about half would be frozen at a temperature of -28° C. In clouds with a droplet size of 5 microns or greater, therefore, very few supercooled droplets exist at temperatures lower than -35° C and the existence of an icing cloud at such low temperatures is probably an unusual occurrence.The relative proportions of frozen and supercooled droplets in a cloud are important in determining the stability of the cloud. A cloud. is considered to be stable if factors causing rapid dissipation of the cloud are absent. One of the factors that may cause a supercooled cloud to become unstable is the existence of ice particles in the cloud. Ice particles in a supercooled cloud have a lower vapor pressure than the surrounding supercooled drops. As a result of the vapor-pressure gradient existing between the liquid droplets and ice particles, water tends to evaporate from the droplets and condense on the ice particles. Thus, if ice particles are present insufficient number distributed evenly throughout the cloud, the ice particles will grow at the expense of the supercooled drops until they fall out of the cloud in the form of precipitation (reference 7). If too few ice particles appear in a supercooled cloud, they will grow and fall out of the cloud leaving it practically intact. On the other hand, if too many ice particles appear, the cloud is merely transformed to an ice-particle cloud. The presence of ice crystals in supercooled clouds is considered to be the principal factor initiating precipitation.
Determination of whether the statistics of freezing are affected by change of environment requires further investigation. For example, if impurities are the cause of freezing in supercooled water, then the average freezing temperature of a given droplet size should be depressed by maintaining as high a degree of cleanliness as possible. In addition, if cleanliness is found to have the anticipated influence, the effect of adding finely divided materials of known constitution to water can be investigated. In the experiments on supercooled water that have been conducted up to the present time, the water has always been in contact with a container or support. In order to attain conditions that approach those in clouds, a method of investigating the freezing-temperature statistics of unsupported droplets must be found.
Citations
This publication is cited by 29 publications, per scholar.google.com.
Related
This is part of the Properties of Water thread.
Notes
-
Levine, Joseph: Statistical Explanation of Spontaneous Freezing of Water Droplets. NACA-TN-2234, 1950. ntrs.nasa.gov ↩