"in icing conditions, periodic attempts should be made to throwoff the accretions by increasing propeller speed."
"The Effect of Ice Formations on Propeller Performance" 1
Abstract
Measurements of propeller efficiency loss due to ice formation are supplemented by an analysis to establish the magnitude of efficiency losses to be anticipated during flight in icing conditions. The measurements were made during flight in natural icing conditions; whereas the analysis consisted of an investIgation of changes in blade-section aerodynamic characteristics caused by ice formation and the resulting propeller efficiency changes. Agreement in the order of magnitude of efficiency losses tobe expected is obtained between measured and analytical results. The results indicate that, in general, efficiency losses can be expected to be less than 10 percent; whereas maximum losses, which will be encountered only rarely, may be as high as 15 or 20 percent. Reported. losses larger than 15 or 20 percent, based on reductions in airplane performance, probably are due to ice accretions on other parts of the airplane.
Blade-element theory is used in the analytical treatment, and calculations are made to show the degree to which the aerodynamic characteristics of a blade section must be altered to produce various propeller efficiency losses. The effects of ice accretions on airfoil-section characteristics at subcritical speeds and their influence on drag-divergence Mach number are examined, and the attendant maximum efficiency losses are computed. The effect of kinetic heating on the radial extent of ice formation is considered, and its influence on required length of blade heating shoes is discussed. It is demonstrated how the efficiency loss resulting from an icing encounter is influenced by the decisions of the pilot in adjusting the engine and propeller controls.
Discussion
This publication is extensive (80 pages), so only selected sections to illustrate some findings are included here.
INTRODUCTION
It has long been recognized that one of the hazards of flight in. icing conditions is the formation of ice on propellers. The presence of ice on propeller blades causes a decrease in the operating efficiency of the propeller and. a corresponding decrease in the-airplane performance. There has been much disagreement as to the actual magnitude of efficiency losses experienced in icing conditions. Measurements have been made of propeller efficiency losses with simulated ice formations (references 1 and 2) and. in natural icing conditions (reference 3). The measured losses were low when compared with those generally expected; however, reports of very large apparent losses, deduced from decrease in airplane performance, persisted. A review of the available data (references 1, 2, and 3) indicated, that further efficiency-loss measurements supplemented by an analysis of the problem would be required. before conclusive statements could be made regarding the order of magnitude of losses to 1e anticipated in icing conditions. The objectives of the present investigation, therefore, were to provide additional measurements of propeller efficiency loss resulting from ice formation, and to analyze the problem of efficiency loss in an attempt to provide a means for applying, generally, the existing data. Thus, additional data to determine efficiency loss were obtained in flight under natural icing conditions as part of a comprehensive investigation of aircraft icing by the NACA. Another phase of the program (reported in reference 4) was the investigation of the meteorological factors conducive to icing, therefore providing quantitative data on the severity of the icing conditions under which propeller-performance measurements were made.
The research was conducted by the Ames Aeronautical Laboratory. Data were obtained over most of the United States during the winters of 1946—47 and 1947-48. Measurements made during the winter of 19146-47 are included in reference 3. The results of the 194-48 winter season are presented in this report.
Appreciation is extended. to United Air Lines, Inc., the United States Weather Bureau, and the Air Materiel Command of the U. S. Air Force for aid and cooperation in the research.
DESCRIPTION OF EQUIPMENT
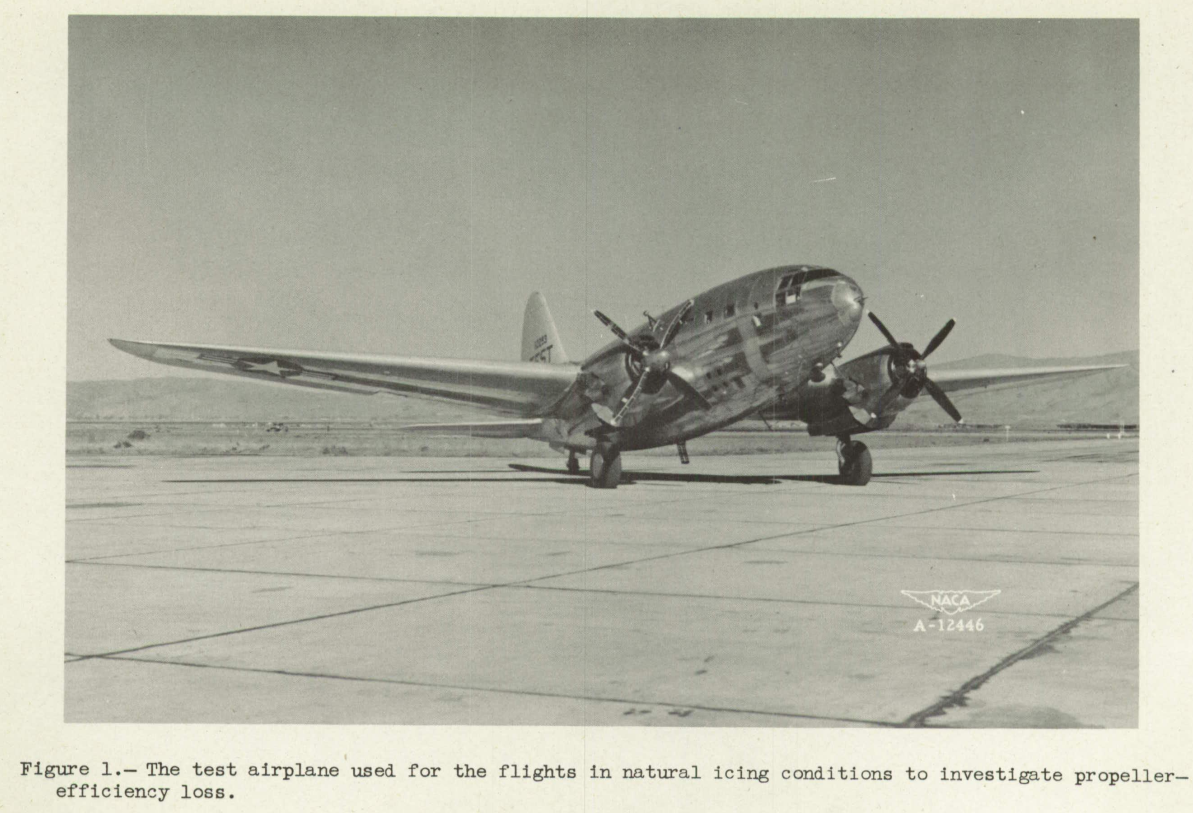
The flight tests were conducted with the twin-engine airplane shown in figure 1. Modifications had been made to provide thermal ice-prevention equipment for the wings, tail, and windshield. A description of the thermal system is given in reference 5. The right engine and propeller were utilized for the purposes of the research, and standard commercial electrically heated blade shoes were installed on the left propeller for ice protection.
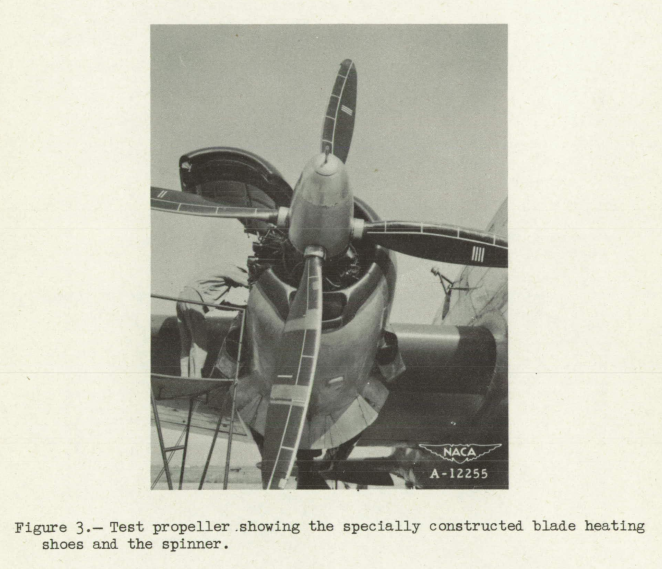
The test propeller consisted. of four blades composed of double-camber Clark Y sections. The diameter was 13.5 feet. Characteristics of the blade design as supplied by the manufacturer are given in figure 2. The symbols used in this figure and throughout the report are listed and defined in Appendix A. Specially built blade heating shoes, constructed at the Ames Laboratory, were installed. for propeller heating tests, which were made in conjunction with the performance tests. The shoes consisted of several wrappings of cloth tape in which the heater elements were embedded. Two-inch-wide strips of metal were cemented over the wrappings along, the leading edges of the blades in order to protect the shoes from abrasion. An enlarged spinner, built for the purpose of housing instrumentation related to the heating studies, was mounted on the test propeller. Figure 3 shows the test propeller complete with heating shoes and spinner. White marking lines were painted on the blades for ease in noting ice locations.
A thrustmeter and a torquemeter were installed in the right engine for measuring thrust and torque absorbed by the test propeller. Both the thrustmeter and the torquemeter utilized pistons which were hydraulically restrained so that the pressure required to maintain the pistons in a floating condition gave a measure of thrust or torque being absorbed by the propeller.
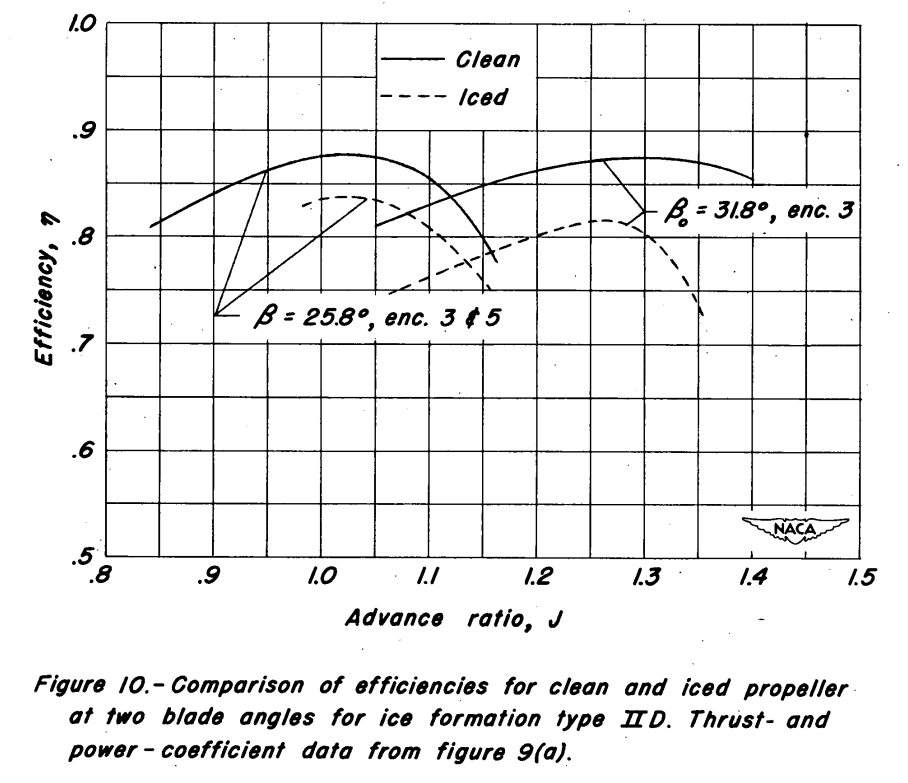
Curves of efficiency as a function of advance ratio for the propeller with ice accumulations are compared with efficiency curves for the clean propeller in figures 10 to 16. These curves were drawn employing values of thrust and power coefficients from table III and from the curves of figure 9 by using the formula
η = CT / CP J

where
η    propeller efficiency
CT   thrust coefficient
CP   power coefficient
J    advance ratio
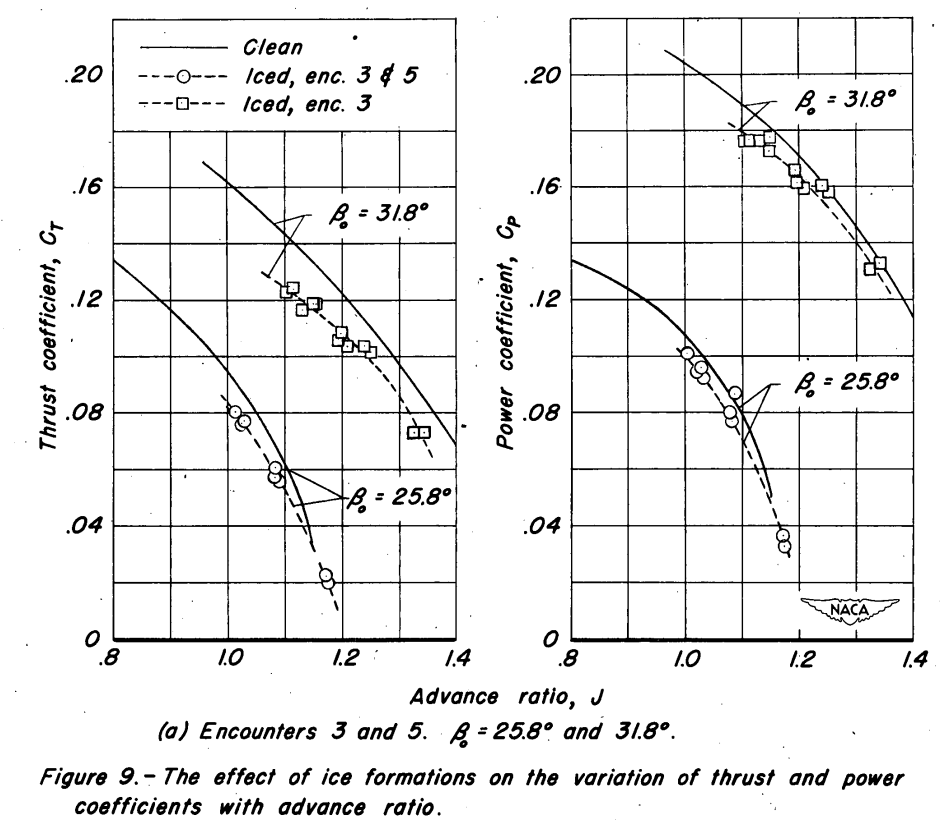
Figure 10 presents the variation of efficiency loss for one type of formation at two blade angles, and figure 11 shows the efficiency-loss. variation for another class of formation at approximately the same blade angles. A comparison of efficiency losses for two classes of formation for the same blade angle is given in figure 12, while figure 13 compares losses for five formations at a higher blade angle, and figure 14 compares losses for two formations at a still higher blade angle. Figure 15 gives the efficiency loss for a low-temperature condition in which the ice extended, nearly to the blade tips. Figure 16 presents a plot of efficiency data for formations which accumulated during two encounters with propeller-blade heating. Heat was applied cyclically to the forward 10 percent of the blade chord and., as was mentioned previously, primary ice formations, together with small amounts of runback, gathered back of the heated regions.
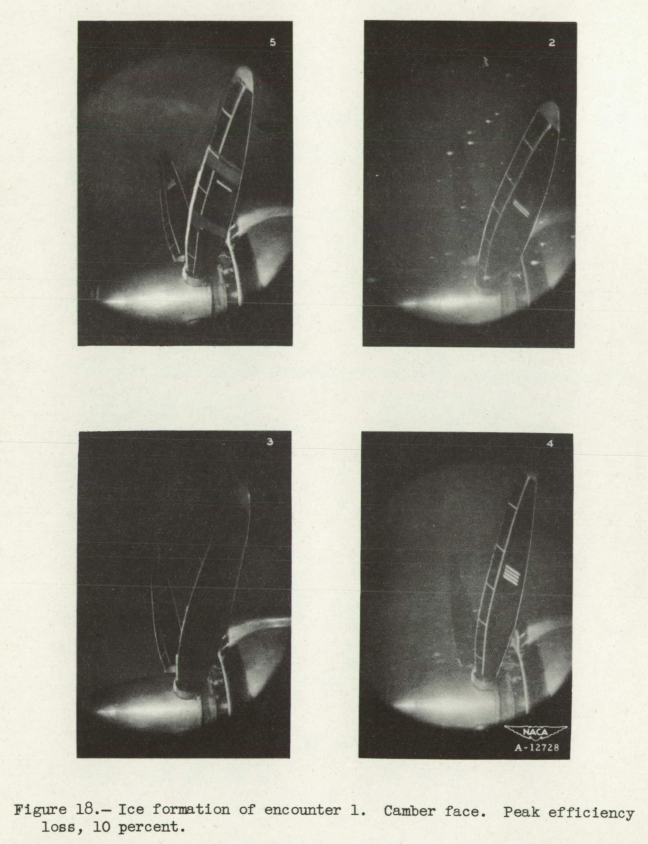
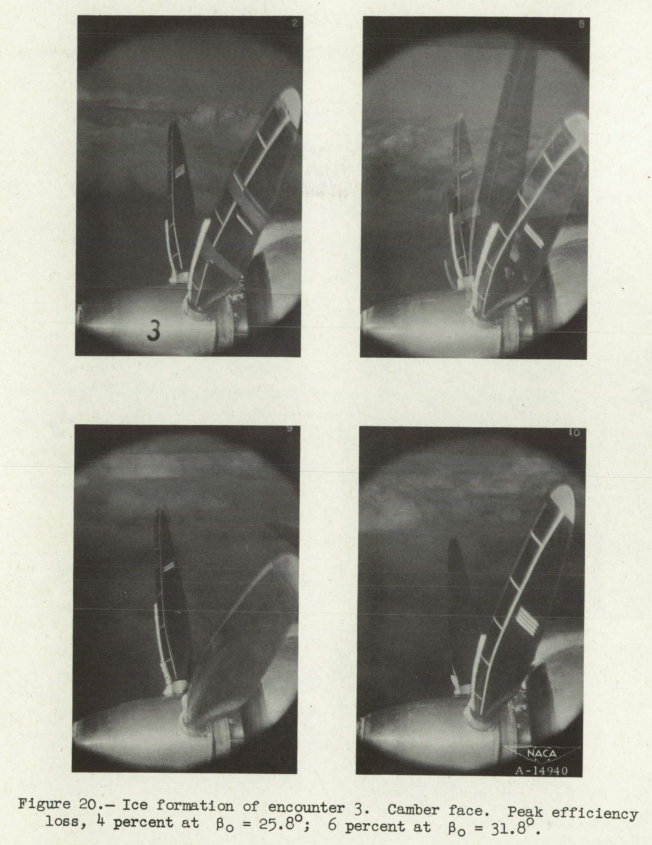
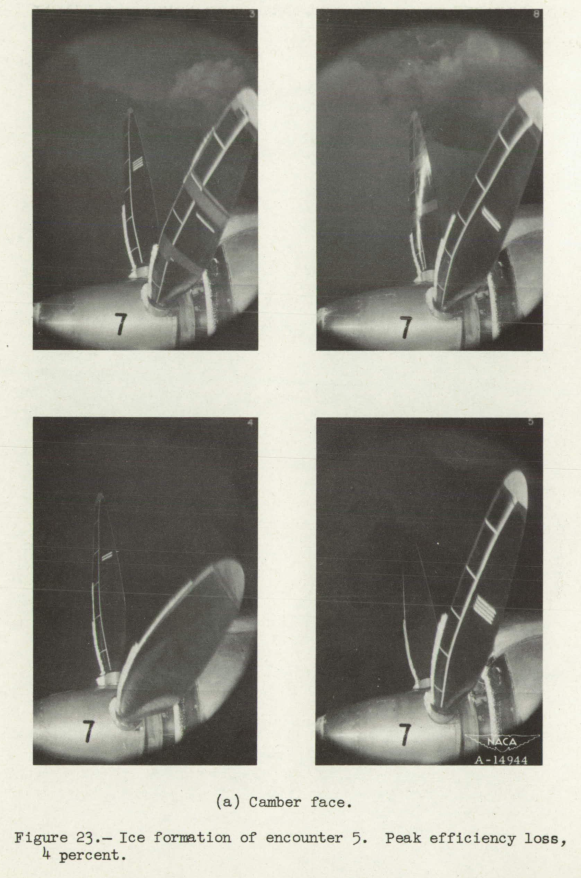
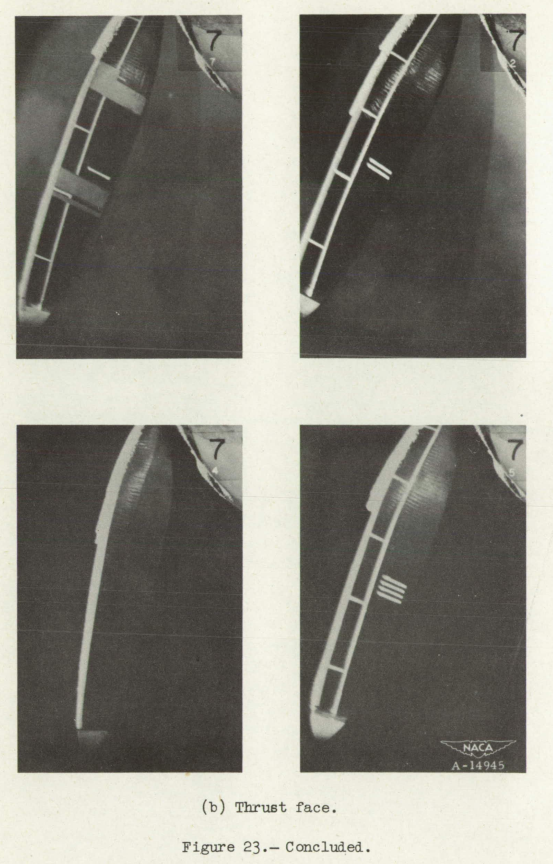
Photographs of the clean propeller blades with heating shoes Installed are shown in figure 17. These show the leading-edge metallic abrasion strips installed on the blades and the white-line markings painted on the shoes to provide a means for identifying the particular blade photographed and. the extent of ice formations. It will be noted. that, In some of the pictures of the thrust face of the blades, the leading-edge abrasion strips unfortunately give the appearance of ice formations and, therefore, should not be confused with the actual formations. Pictures of the ice accretions for which efficiency data were obtained are presented in figures 18 to 31.

Influence of Operating Conditions on Propeller Efficiency Losses in Icing Conditions
When a propeller accumulates ice, the resulting changes in propeller performance are reflected in corresponding changes in airplane performance. Depending on how the pilot reacts to the changes, various operating conditions can be established which may have an increased detrimental effect on the propeller performance.
Thus it appears that in operation of unprotected or inadequately protected propellers in icing conditions, periodic attempts should be made to throwoff the accretions by increasing propeller speed. If the ice cannot be removed, it is desirable to operate at or near the peak of the efficiency-envelope curve for the iced. propeller. This peak is probably located at about the same value of advance ratio as the peak for clean blades.
Conclusions
As the result of measurements of propeller performance loss due to ice formation, made during flight in natural icing conditions and supplemented by an analysis of the factors contributing to performance loss (in which all values apply for propeller advance ratios up to about 2), the following conclusions are reached:
1. During the vast majority of icing encounters with unprotected propellers on present-day transports, propeller efficiency losses can be expected to be less than 10 percent.
2. The maximum loss to be anticipated for propellers free of adverse compressibility effects is about 15 percent; hereas, for propellers operating above the critical speed, the maximum loss to be expected is about 20 percent. 3. Reported propeller efficiency losses larger than about 15 or 20 percent, based on reductions in airplane performance, probably are actually due to icing of other components. 4. The magnitude of efficiency loss resulting from an icing encounter can be influenced, by the decisions of the pilot in adjusting the engine and propeller controls.
Citations
This publication is cited 16 times, per scholar.google.com.
Some are recent, such as:
- Hann, Richard, and Tor Arne Johansen. "Unsettled topics in unmanned aerial vehicle icing." (2020) ntnuopen.ntnu.no.
- Müller, Nicolas C., and Richard Hann. "UAV Icing: Validation of an Ice Protection System Design for a Propeller." AIAA Aviation Forum and Ascend 2024. 2024 ntnuopen.ntnu.no.
Related
See also Propeller publications by Porter Perkins.
Notes
Note that the download from ntrs.nasa.gov has the correct 80 pages from NACA-TN-2212, but 54 pages of NACA-TN-2185 are appended.
-
Neel, Carr B., Jr., and Bright, Loren G.: The Effect of Ice Formations on Propeller Performance. NACA-TN-2212, 1950. ntrs.nasa.gov ↩