"supercooled water was concluded to become progressively more ice-like as the temperature is lowered"
"X-Ray Diffraction Study of the Internal Structure of Supercooled Water" 1
SUMMARY
A Bragg X-ray spectrometer equipped with a volume-sensitive Geiger counter and Soller slits and employing filtered molybdenum Kα, radiation was used to obtain a set of diffracted intensity curves as a function of angle for supercooled water. Diffracted intensity curves in the temperature region of 21° to -16° C were obtained. The minimum between the two main diffraction peaks deepened continuously with lowering temperature, indicating a gradual change in the internal structure of the water. No discontinuity in this trend was noted at the melting point. The internal structure of supercooled water was concluded to become progressively more ice-like as the temperature is lowered.
Discussion
The extensive equations included in this publication area not detailed herein.
APPARATUS AND PROCEDURE
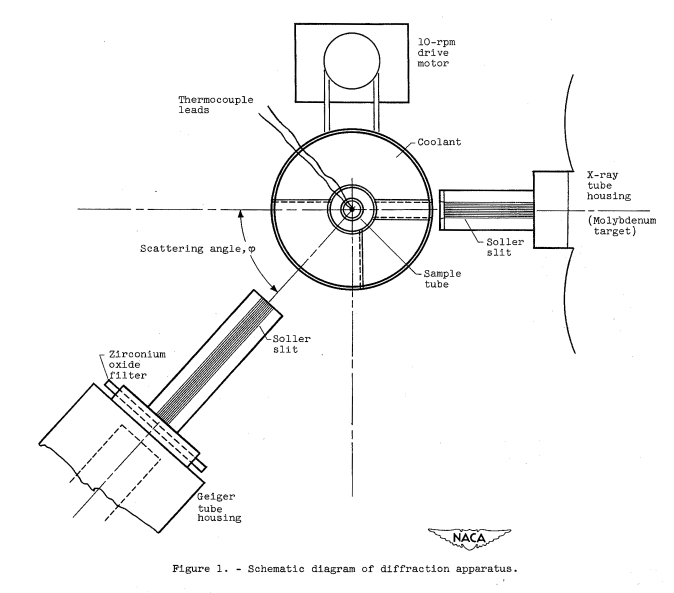
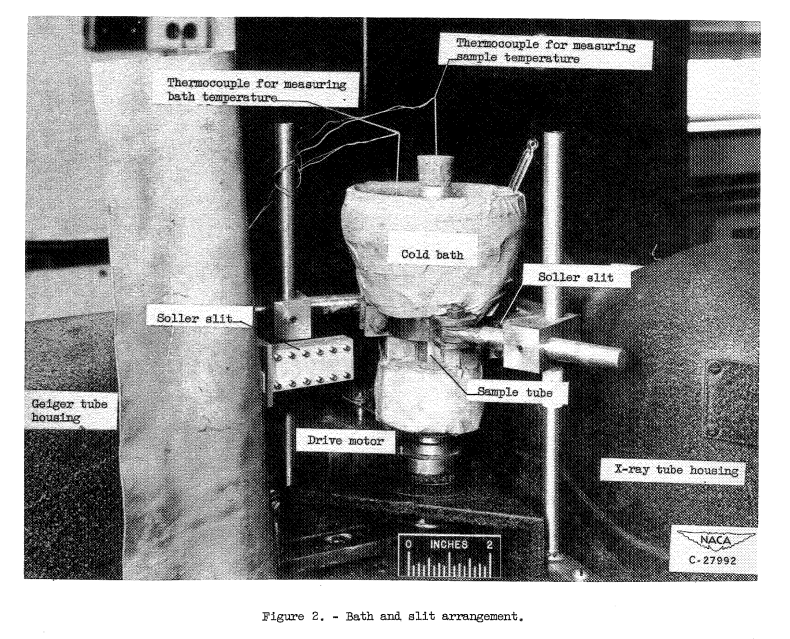
A Bragg X-ray spectrometer equipped with a Geiger counter and Soller slits was employed using filtered molybdenum Kα radiation (figs. 1 and 2). A zirconium oxide filter was used at the Geiger tube entrance. Each Soller slit system consisted of nine channels 0.017 inch wide by 0.365 inch high with lead spacers 0.005 inch thick. A Soller slit 1-3/8 inches long was mounted between the X-ray tube and the sample and a similar one 22 inches long was mounted between the sample and the Geiger counter. The X-ray tube current was held constant by an external current controller that automatically adjusted the filament current to compensate for any changes in tube current...
RESULTS AND DISCUSSION
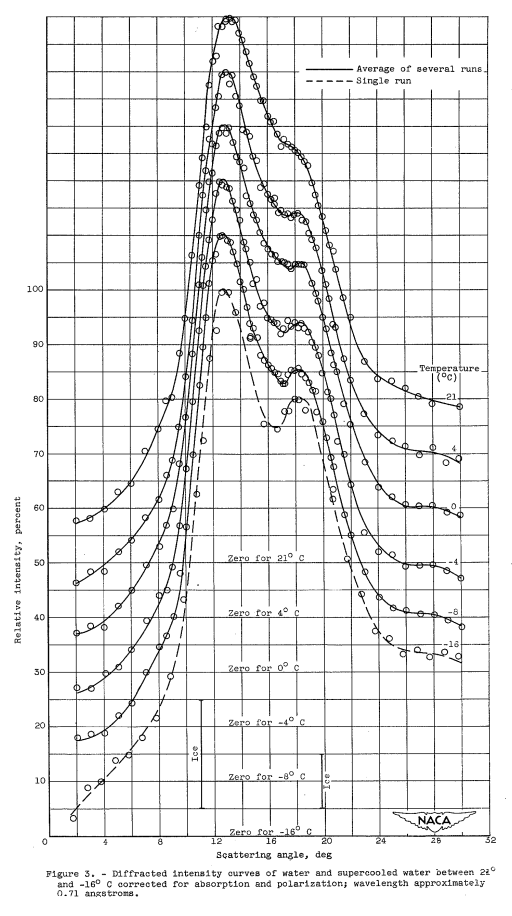
The average diffracted intensity curves, ranging from 21° to -8° C, corrected for absorption, polarization, and scattering by the glass container, are shown in figure 3. A diffracted intensity curve for a single data run at -16° C is indicated in the same figure by a dashed line; in addition, the positions and relative intensities of the two most intense diffraction peaks for ice (reference 8) are shown. The curves at 21° and 4° C were obtained for direct comparison with the supercooled data and are in good agreement with previously published data in this temperature region although the resolution of the two prominent peaks is somewhat inferior. This sacrifice in resolving power was necessary in order to keep the time required for the supercooled data runs to a minimum and thus reduce the probability of accidental crystallization of the water sample.
There are three interesting features of this set of diffracted intensity curves (fig. 3):
(1) The most prominent peak shows a small but continuous shift toward smaller scattering angles as the temperature is lowered. The peak shifts from 13° 15' at 21° C to 12° 40' at -8° C. (2) The second diffraction peak shows no tendency to shift angular position with temperature but remains at a scattering angle of approximately 18° 20' throughout the temperature range investigated.
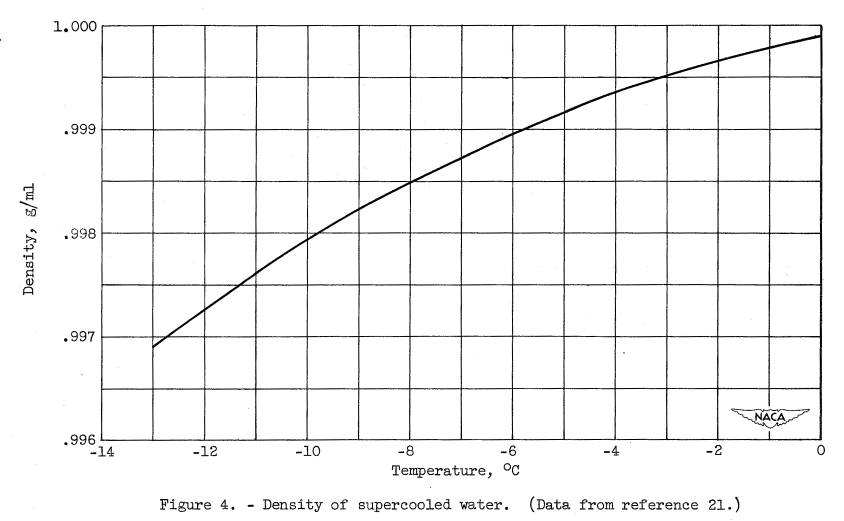
(3) The most striking feature of the set of diffracted intensity curves is the gradual deepening of the minimum between the two main peaks as the temperature is lowered into the supercooled range; that is, the second peak becomes more sharply resolved. This is a continuation of the trend found by other investigators at temperatures above the melting point and is an indication that the internal structure of the water is apparently changing in a gradual and continuous manner as the degree of supercooling is increased. No discontinuity in this trend occurs at the melting point. Analysis of diffraction curves above the melting point by previous investigators (references 11 and 17) indicate that the increase in resolution of this second peak as the temperature is lowered is due to a more ice-like internal structure of the water sample. Therefore, a reasonable conclusion that can be drawn, for the temperature range investigated, is that the supercooled water is becoming progressively more ice-like in structure as the temperature is lowered. This trend is consistent with the density change with temperature of supercooled water reported in reference 21 and shown in figure 4. The density of water decreases throughout the supercooled range indicated in the figure. This decrease could only be explained by a gradual change in the internal arrangement of the water molecules toward a less closely packed structure.
CALCULATION OF SPONTANEOUS FREEZING TEMPERATURE FROM DIFFRACTION DATA
Various theories of the mechanism of the initiation of crystallization of supercooled water by homogeneous nucleation involve assumptions that the internal structure of supercooled water becomes locally more ordered, or more ice-like, as the temperature is lowered; that is, groups of molecules form ordered aggregates or microcrystals which can act as freezing nuclei. Whether or not these aggregates can initiate crystallization depends on their structure, their effective size, and the temperature of the supercooled water. Inasmuch as the X-ray diffraction data of this report indicate that the internal structure of supercooled water apparently becomes progressively more ice-like as the temperature is lowered, qualitative support is lent to the suggestions appearing in the literature (for example reference 7) that the spontaneous freezing temperature can be calculated theoretically from the Thomson equation presented in reference 22. The temperature Tr, at which an isomorphic particle of equivalent radius r can initiate freezing, as given by the Thomson relation...In ice, each molecule is surrounded by four other molecules at a radial distance of 2.76 A [Angstrom, 1^-10 m] with a second set of neighbors at a radial distance of 4.51 A. In reference 7, the radius of this second sphere of coordination for ice is assumed to be the effective radius of the homogeneous nucleus and the spontaneous freezing temperature of supercooled cooled water is calculated from the Thomson equation to be:
Tr - TN ~= -41° C
This calculated spontaneous freezing temperature agrees well with the
experimental results of references 3 and 4.
In order for the Thomson equation to be valid, the particle acting as nucleus must be truly isomorphic because no term that takes into account the work of nucleus formation is included. If it is assumed that the microcrystals present in supercooled water have a lattice structure identical with that of ice at the spontaneous freezing temperature, these microcrystals are truly isomorphic nuclei and the equation can be applied directly. This calculation therefore depends on the assumption that the 4.51 A sphere of coordination found in the ice lattice is also present in supercooled water. In reference 17, the radial distribution curves calculated for molecules about a given molecule for water at 1.5° C show a marked concentration of neighbors at a distance of about 4.5 A. Thus, if ice-like microcrystals of about 4.5 A radius were present in supercooled water at approximately -41° C, they would initiate crystallization at this temperature as no work of nucleus formation would be needed and their
radius would be of sufficient size to permit growth. The X-ray diffraction data of this report lend qualitative support to the theory of nucleation presented; however, too much reliance cannot be placed on a calculation of this type for the following reasons:
(1) There is still a question as to whether freezing of water droplets or direct sublimation occurs in clouds at temperatures in the region from -38° to -42° C
(2) Heterogeneous nucleation (such as that due to ions from dissolved salts, reference 23) maybe active even in this temperature region (see reference 5)
(3) In reference 24 it is reported that water has been supercooled to -72° C (although as yet not duplicated by others)
(4) The liquid-solid interfacial surface energy is not known precisely
(5) The X-ray diffraction data of this report extend only as low as -16° C.
Conclusions
SUMMARY OF RESULTS
Diffracted intensity curves using filtered molybdenum Kα radiation representing the average of several runs were obtained in the temperature range 21° to -8° C. A diffracted intensity curve for a single run at -16° C was also obtained. The important features of the set of diffracted intensity curves are:
(1) the most prominent peak shifted from a scattering angle of 13° 15' at 21° C to 12° 40' at -8° C,
(2) the second diffraction peak remained at an approximately fixed angle of 18° 20' throughout the temperature range investigated,
(3) the minimum between the two main peaks deepened continuously as the temperature was lowered, resulting in better resolution of the two peaks as the temperature was lowered.It is concluded that the changes in the diffracted intensity curves are an indication of changes in the internal structure of the supercooled water, which apparently becomes progressively more ice-like in structure as the temperature is lowered.
Citations
This publication is cited by three publications, per scholar.google.com.
Related
This is part of the Properties of Water thread.
Notes
-
Dorsch, Robert G., and Boyd, Bemrose: X-Ray Diffraction Study of the Internal Structure of Supercooled Water. NACA-TN-2532, 1951. ntrs.nasa.gov ↩