"a need has arisen for a more complete understanding of the physical properties of supercooled water because few of the physical properties of water have been investigated at temperatures much below 0° C"
"Experimental Values of the Surface Tension of Supercooled Water" 1
Abstract
The results of surface-tension measurements for supercooled water are presented. A total of 702 individual measurements of surface tension of triple-distilled water were made in the temperature range, 27° to -22.2° C, with 404 of these measurements at temperatures below 0° C. The increase in magnitude of surface tension with decreasing temperature, as indicated by measurements above 0° C, continues to -22.2° C. The inflection point in the surface-tension-temperature relation in the vicinity of 0° C, as indicated by the International Critical Table values for temperatures down to -8° C, is substantiated by the measurements in the temperature range, 0° to -22.2° C. The surface tension increases at approximately a linear rate from a value of 76.96±0.06 dynes per centimeter at -8° C to 79.67±0.06 dynes per centimeter at -22.2° C.
Discussion
This publication has been cited many times (see the "Citations" section), including in several more recent publications.
INTRODUCTION
The current interest in supercooled water is due in part to increased research on aircraft icing, condensation shocks in supersonic flow, and natural and artificially induced precipitation. As a result of this interest, a need has arisen for a more complete understanding of the physical properties of supercooled water because few of the physical properties of water have been investigated at temperatures much below 0° C.
Surface tension is one of the physical properties of water that influences the formation and growth of liquid-water droplets from air saturated with water vapor. This condensation process very often occurs at temperatures below 0° C in the atmosphere and in flowing gas streams that are subject to adiabatic cooling. For a complete understanding of the condensation phenomenon at temperatures below 0° C, the surface tension of water at these temperatures must therefore be evaluated. The surface tension of water has been measured to -8° C (reference 1), but some doubt exists as to the validity of the results obtained below 0° C because of a weak inflection point in the surface-tension-temperature curve in the vicinity of 0° C. The validity of this inflection point is questionable because of the experimental difficulties involved in obtaining data at temperatures below 0° C. Because of this uncertainty, extrapolation of the surface-tension-temperature relation to very low temperatures is difficult.
The investigation reported herein was conducted to determine experimentally the surface tension of water to as low a temperature as possible. This information in combination with other facts concerning the physical properties of supercooled water would be useful in determining the time-mean structure of supercooled water and the reasons for the existence and apparent stability of supercooled water, as well as droplet formation and growth from air saturated with water vapor at temperature below 0° C.
METHOD AND THEORY
There are numerous methods for determining the surface tension of liquids, for example, capillary rise, drop weight, and tensiometer methods. Excellent summaries of most of the standard methods are presented in references 2 and 3. The standard methods, however, are unsatisfactory for the determination of surface tension of supercooled water for either or both of the following reasons:
(1) Most methods require a knowledge of the density of the liquid, which is unknown for supercooled water at temperatures considerably below 0° C.
(2) The volume of liquid necessary for most of the standard methods is so great that a high degree of supercooling is improbable.
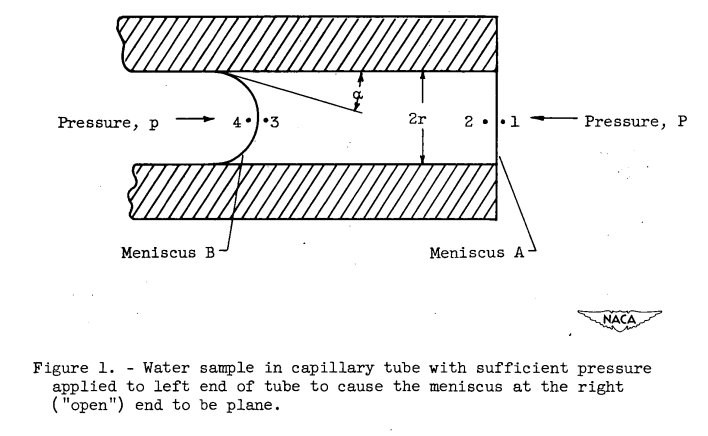
According to reference 4, as the volume of water is increased the degree of supercooling possible decreases.The method adopted for this investigation is a very ingenious method devised by Ferguson (reference 5) and modified by Ferguson and Kennedy (reference 6). This method eliminates the disadvantages of the more standard methods in that the density of the liquid under measurement need not be known and the volume of liquid required is less than 1 cubic millimeter. Essentially, the method is as follows: A small quantity of water is place din a small-bore capillary tube that is supported in a horizontal position (fig. 1). Pressure is applied to one end of the tube until the liquid is forced into such a position that the meniscus at the other ("open") end of the tube is plane instead of curved. The pressure required to force the meniscus to a plane position is proportional to the surface tension.
The method is based upon the same physical phenomenon that causes a liquid to rise in a small-bore capillary tube; namely, the pressure difference across a curved surface at a gas-liquid boundary.
APPARATUS AND PROCEDURE
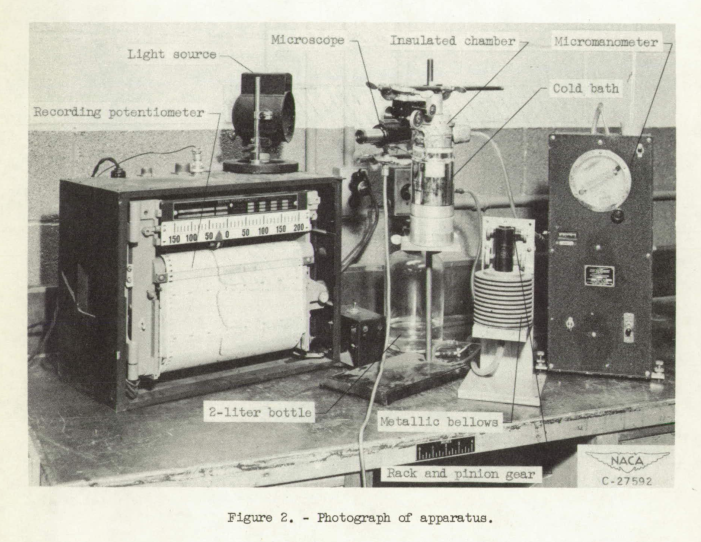
The apparatus used in this investigation consisted of the following components (figs. 2 and 3): (1) a capillary tube for holding the water sample, (2) a cold bath for cooling the capillary tube and water sample, (3) a bellows and a rack and pinion gear arrangement for changing the pressure applied to the water sample, (4) a micromanometer to measure the applied pressure, (5) a light source and microscope for determining when the meniscus at the "open" end of the capillary tube is plane, and (6) a thermocouple and potentiometer for measuring and recording the temperature of the water sample.
RESULTS AND DISCUSSION
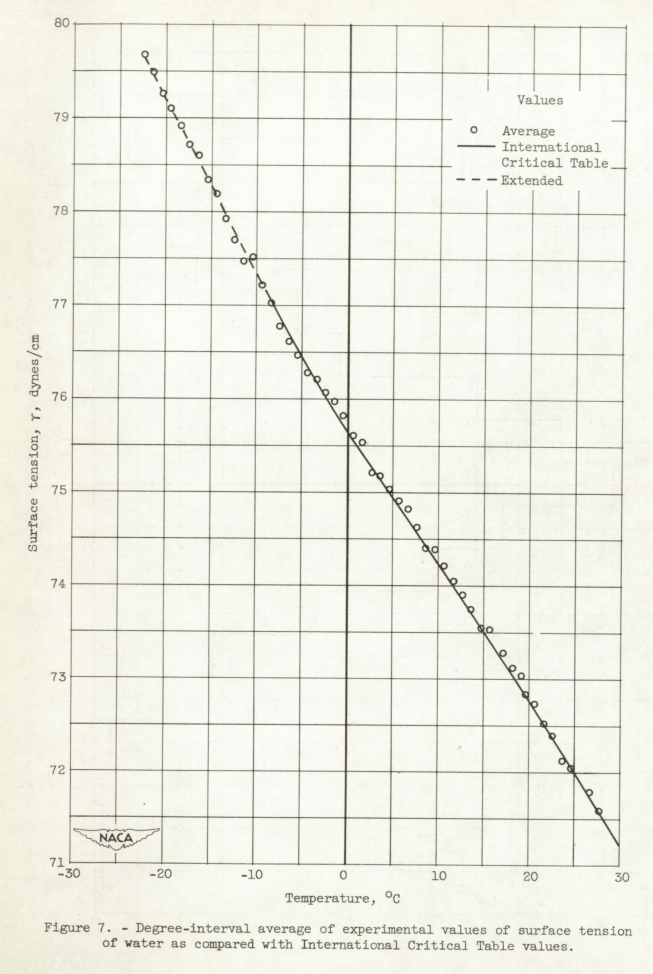
A close inspection of the International Critical Table values presented in figure 7 or table I shows that the rate of increase in the value of surface tension, with decreasing temperature, decreases from 27° to approximately 0° C and then starts to increase at lower temperatures; a weak inflection point in the surface-tension-temperature curve must therefore exist in the vicinity of 0° C. Some doubt exists, however, concerning the validity of the inflection point because of the experimental difficulties involved in obtaining data at temperatures below 0° C. In th temperature range, -8° to -22.2° C, however, the measurements obtained. in this investigation are consistent with the existence of this inflection point. The average values of surface tension (fig. 7) indicate that surface tension increases at approximately a linear rate from 76.96 ±0.06 dynes per centimeter at -8° C to 79.67±0.06 dynes per centimeter at -22.2° C, and the rate of increase of surface tension with decreasing temperature is greater in the temperature range, -5° to -22.2° C than in the range, 27° to -5° C.
Conclusions
The surface tension of water in the supercooled region continues to increase in magnitude with decreasing temperature, as it does above 0° C, and. reaches a value of 79.67±0.06 dynes per centimeter at 22.2° C. The inflection point in the vicinity of 0° C indicated. by the International Critical Table values appears to be real and the rate of increase of magnitude of surface tension with decreasing temperature is larger in the temperature range, -5° to -22.2° C than in the range, 27° to -5° C.
Citations
This publication is cited by 64 publications, per scholar.google.com, including some recent publications.
Related
This is part of the Properties of Water thread.
"Reference 1", "International Critical Tables", can be found at archive.org.
Notes
-
Hacker, Paul T.: Experimental Values of the Surface Tension of Supercooled Water. NACA-TN-2510, 1951. ntrs.nasa.gov ↩