"The current use of improved airplane ice-prevention equipment has extended operations in icing conditions and thus accentuated the need for protecting aircraft antennas against structural failures resulting from ice accretions"
"Determination of Aircraft Antenna Loads Produced by Natural Icing Conditions" 1
Abstract
A flight investigation was made to determine the effect of distance flown in the icing region, antenna length, and antenna angle on the tension occurring in aircraft antennae while in regions of aircraft icing.
The, experimental antennas were of lengths ranging from 15 to 43 feet and were placed at angles of 0° to 64° with the airplane thrust axis. Distances up to 256 miles were flown in diverse icing conditions at true airspeeds from 157 to 214 miles per hour and pressure altitudes at which icing conditions were encountered.
The results indicate that: The effect of ice formation on antenna tension increased with the angle of the antennas with the longitudinal axis of the airplane. The maximum tension for antennae having angles from 0° to 15° was 68 pounds, whereas the maximum tension for antennas having angles of 44° and 64° was 274 and 438 pounds, respectively.
Discussion
As this publication is brief (25 pages) it is reproduced almost in its entirety herein.
INTRODUCTION
The current use of improved airplane ice-prevention equipment has extended operations in icing conditions and thus accentuated the need for protecting aircraft antennas against structural failures resulting from ice accretions. A flight investigation was therefore conducted at the NACA Cleveland laboratory to determine the tension in aircraft antennas produced by ice formations.
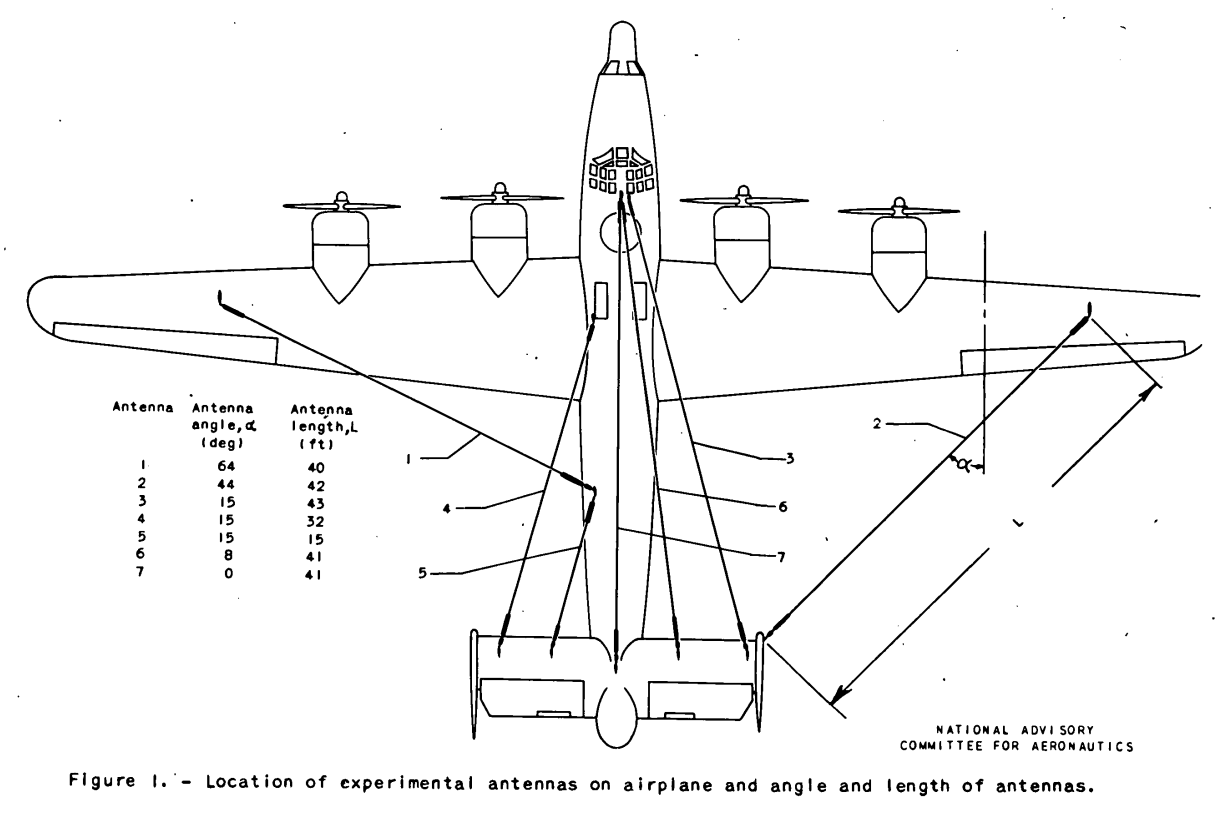
The investigation was conducted in natural Icing conditions over a range of true airspeeds from 157 to 214 miles per hour and altitudes from 3500 to 9500 feet. Seven experimental antennas of lengths ranging from 15 to 43 feet were placed at angles of 0° to 64° with the thrust axis of the airplane. The effect of the following factors on the antenna tension was Investigated: antenna length, included angle between the antenna and the thrust axis of the airplane, and distance flown in the icing region.
APPARATUS AND PROCEDURE The location of the seven experimental antennas on the airplane is shown in figure 1...
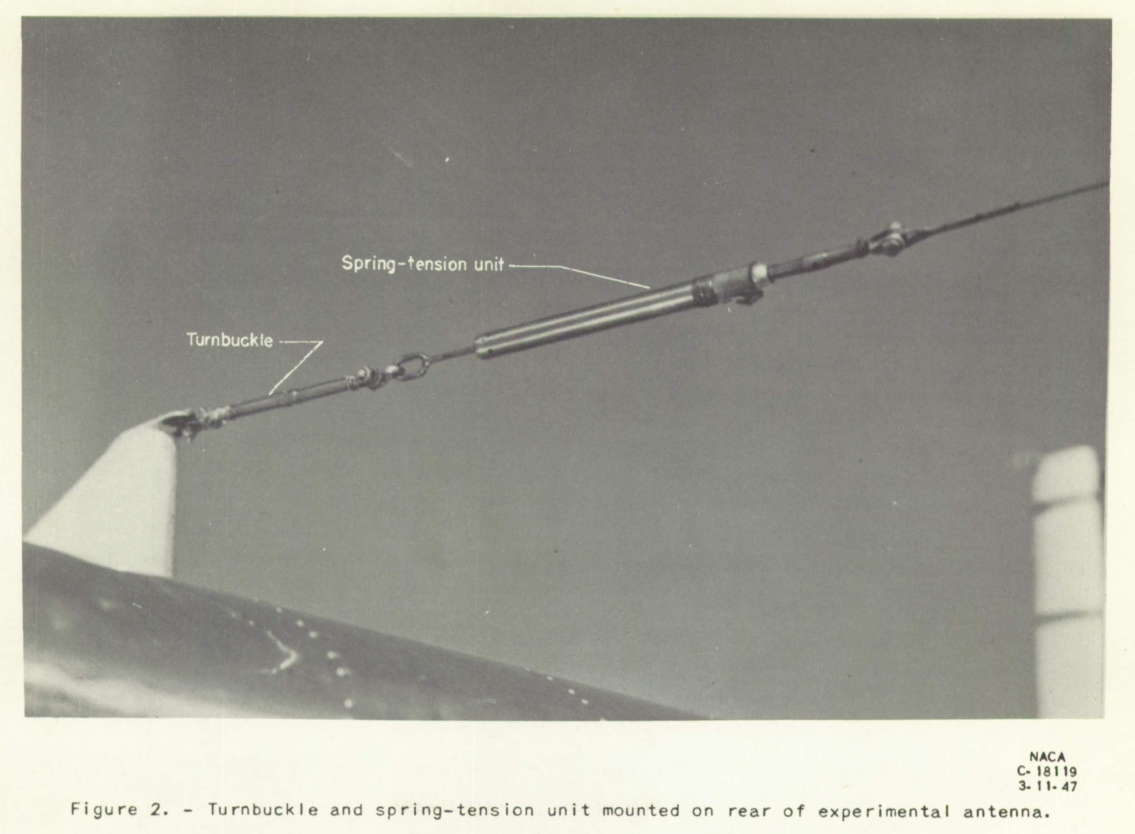
Inasmuch as it was anticipated that the tension which would be imposed on the antennas would exceed the breaking strength of the ordinary antenna wire, the experimental antennae used were of 1/16-inch diameter, 7 by 7, aircraft-control cable. Turnbuckles and spring-tension units were mounted on the rear of the antennas (fig. 2) In order to impose a static tension of 30 pounds.
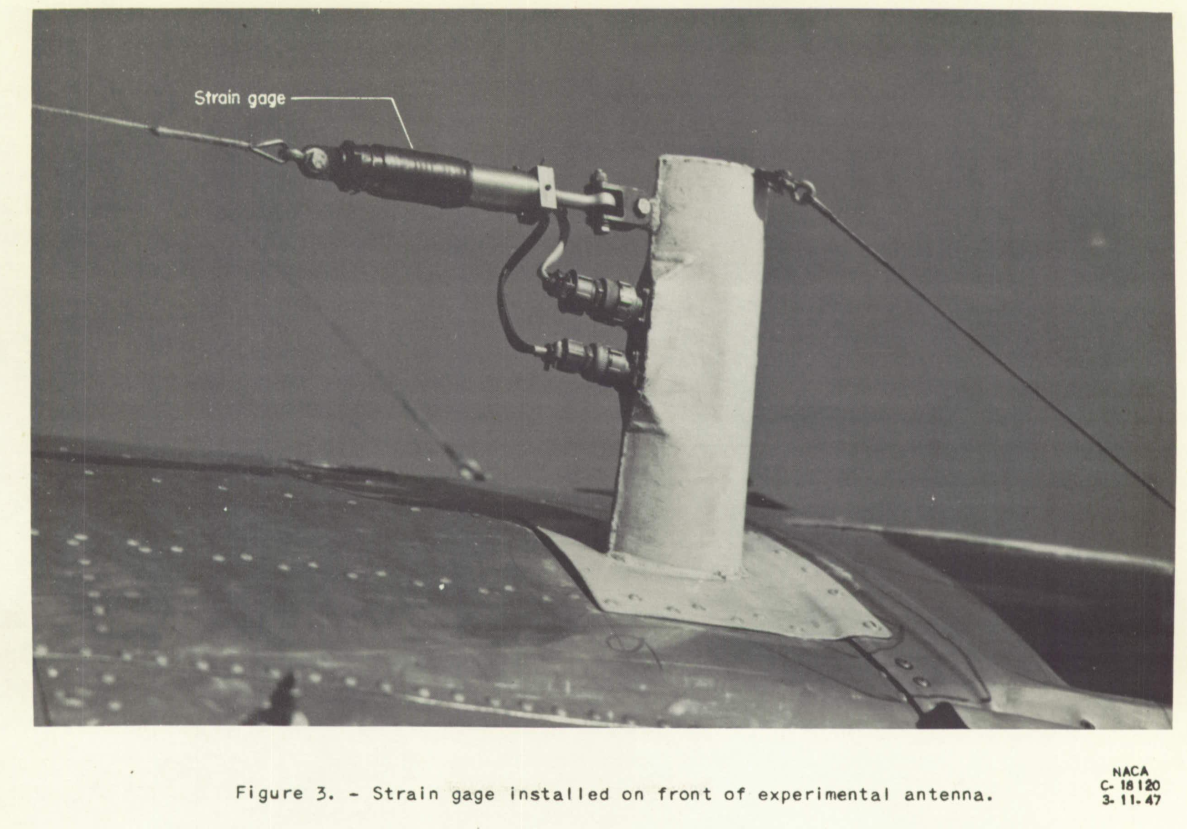
The tension In the antennas was measured by strain gages located at the front of the antennas (fig. 3). The strain gages were temperature-compensating and were sealed In order to keep them moisture-free. Electrically heated anti-icing boots were installed, around the body of the strain gages. A recording galvanometer indicated, the tension in the antennas. The strain-gage system was accurate to ±2 percent.
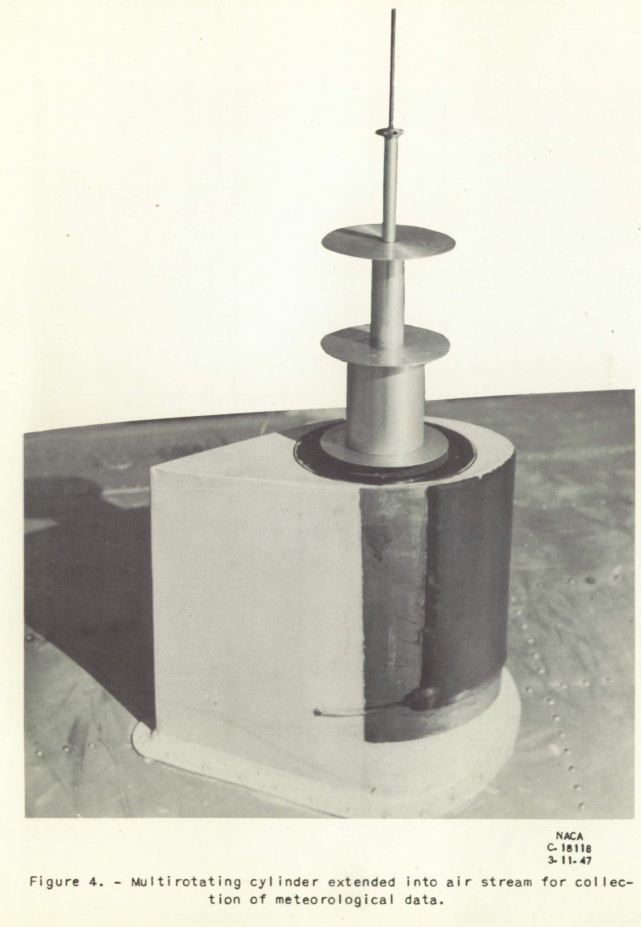
Multirotating cylinders, as shown in figure 4, were used to determine the average droplet diameter, the drop-size distribution, and the liquid-water content. These cylinders were similar to those used in reference 1 with minor mechanical modifications. Pressure altitude and indicated airspeed were measured by service instruments and the ambient-air temperature was measured by a shielded resistance-bulb thermometer.
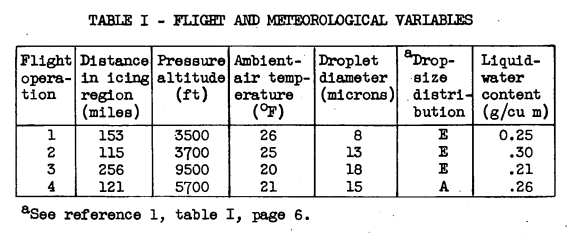
A series of four flights was conducted. Into areas of predicted icing. Table I presents the meteorological conditions for the respective flights. The values shown in this table are the averages of Individual values recorded at intervals throughout each flight operation. The notation for the drop-size distribution corresponds to that given in reference 1, table I, page 6. The factors that made possible the existence and the suspension of supercooled. liquid-water droplets encountered during the flight operations are presented in the appendix.
RESULTS AND DISCUSSION
Photographs of ice configurations on the 8°, 41-foot antenna and the 15°, 32-foot antenna are presented in figures 5 and 6, respectively, and are representative of Ice formations on antennas having angles from 0° to 15°.
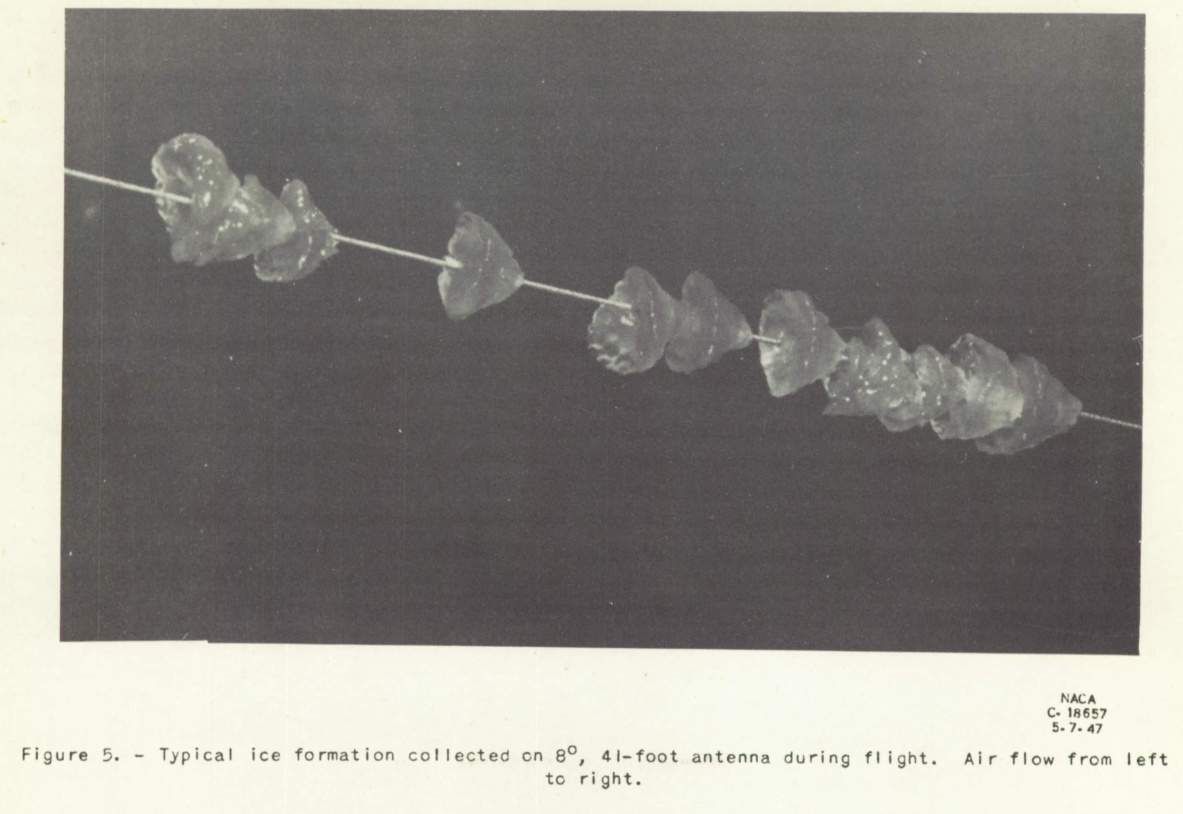
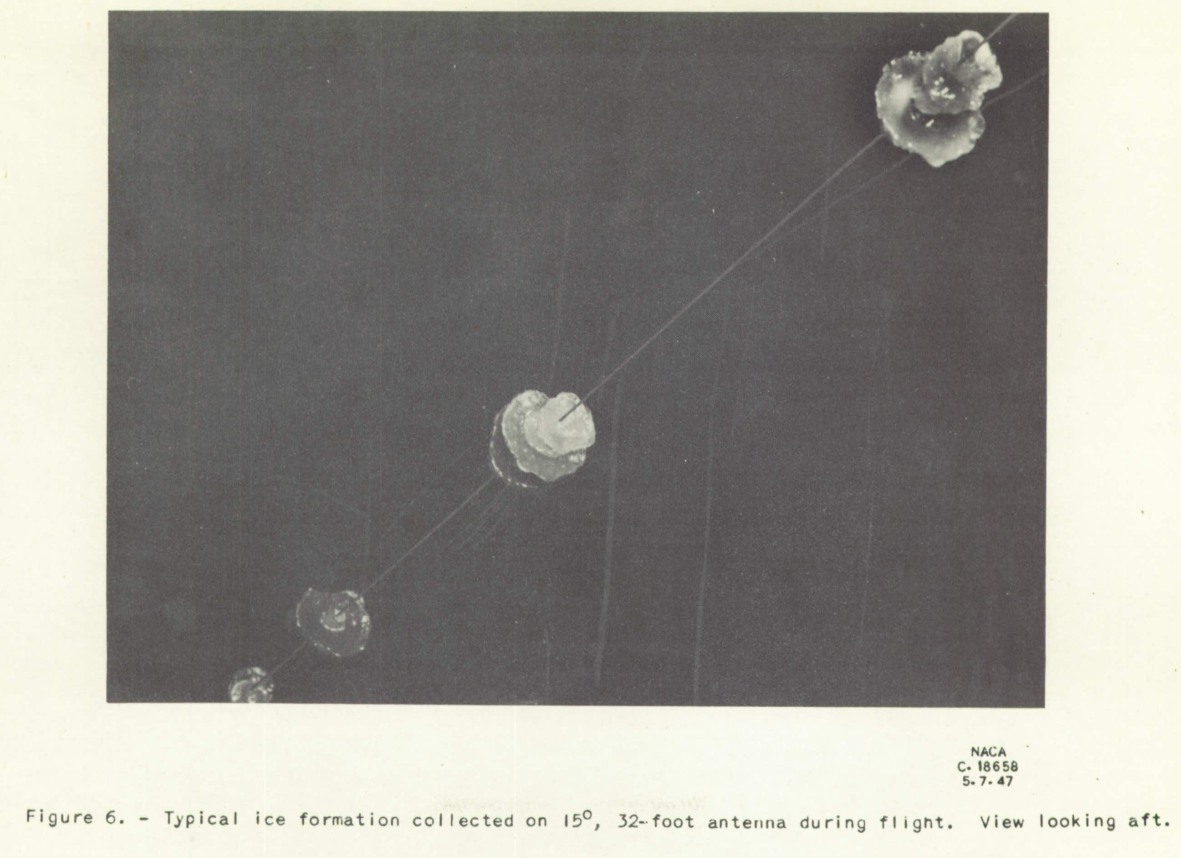
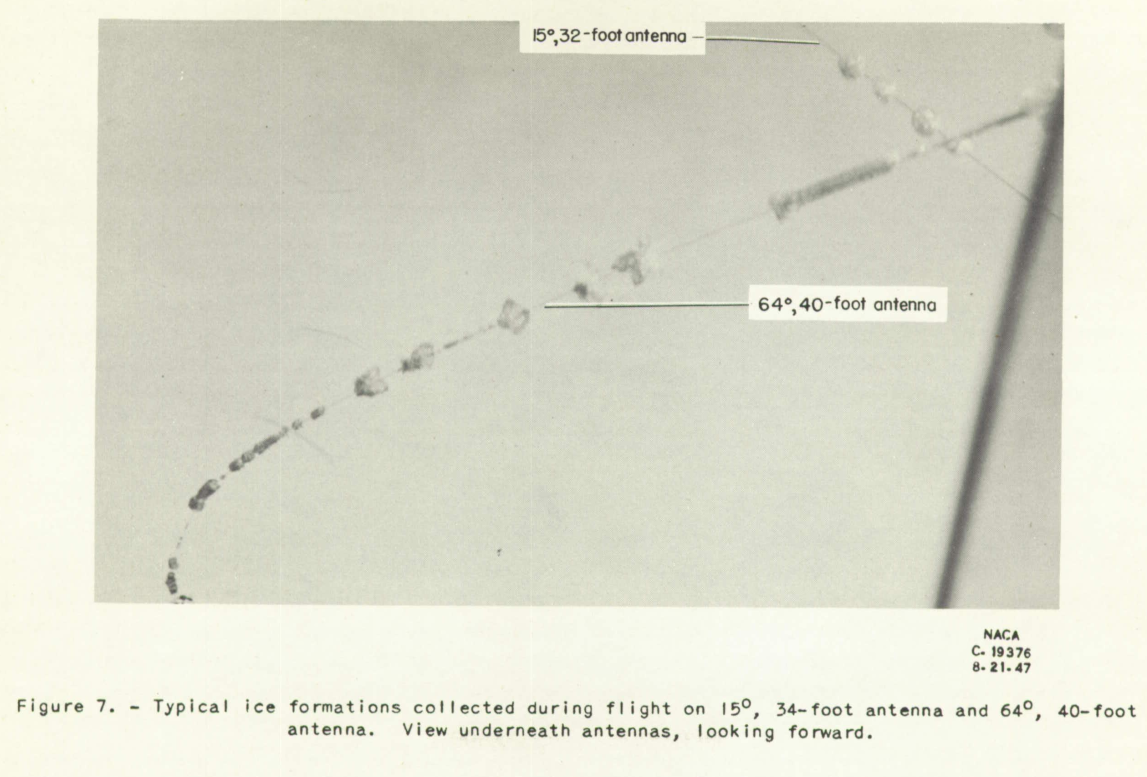
Figure 7 is a photograph, taken in flight, of the ice formation on the 15°, 32-foot antenna and the 64°, 40-foot antenna. The, ice configuration on the 64°, 40-foot antenna is illustrative of configurations collected on the 64°, 40-foot and the 44°, 42-foot antennas during, most of the flight operations.

The variation of antenna tension with distance flown in the icing region for the antennas is presented in figure 8 for the four flight operations. The shaded areas on the figures for the 64°, 40-foot and 44°, 42-foot antennas represent the maximum and minimum tensions produced by whipping. The variation of antenna tension due to whipping for the 0° and 15° antennas was insignificant. Figure 8 shows that, in general, for the 44° and 64° antennas, antenna tension increases considerably with the distance flown In the icing region; whereas, for the antennas of 15° and less, the variation of tension with distance is insignificant. The change in the slope of the antenna-tension curve from positive to negative indicates that whipping of the antennas broke office formations and thereby temporarily reduced the antenna tension.
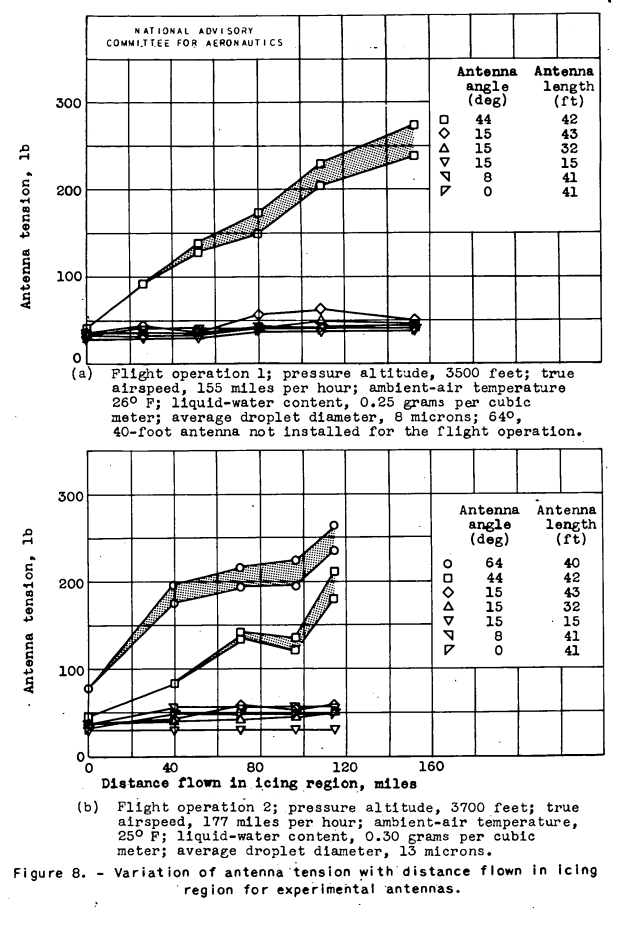
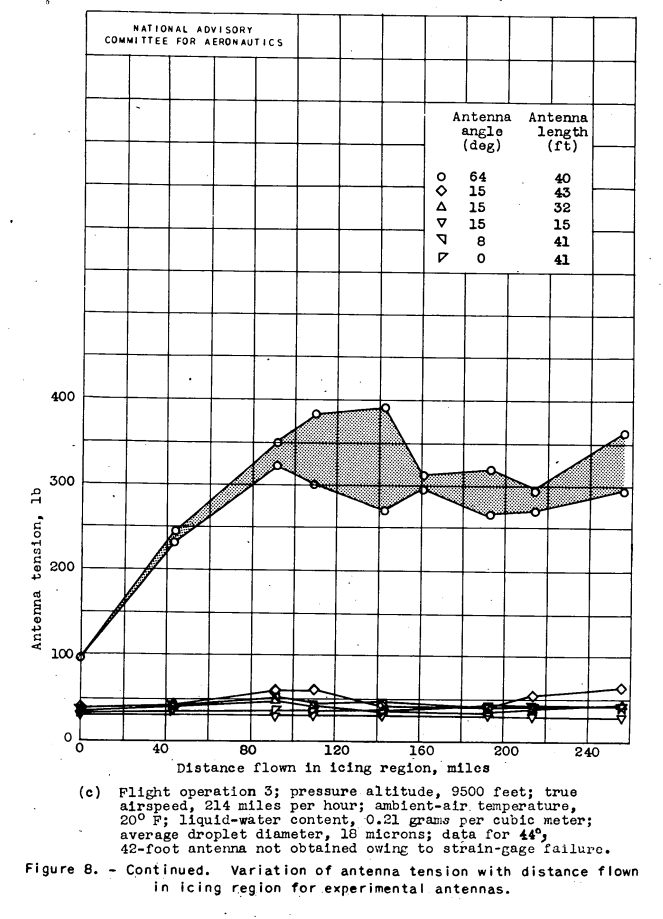
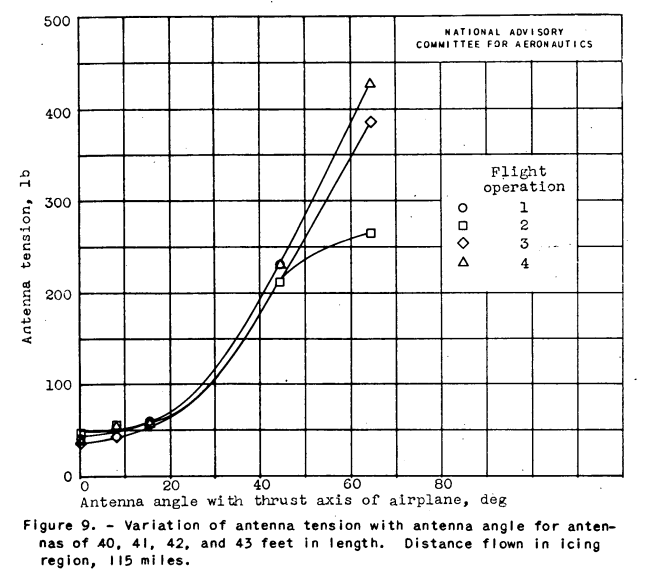
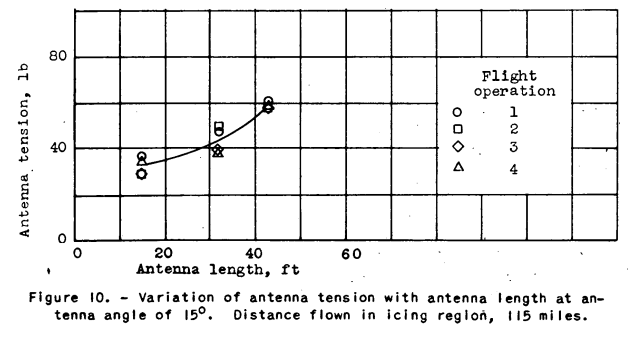
The variation of antenna tension with antenna angle for antennas of approximately 42 feet in length is presented in figure 9. The tension values presented in this figure were obtained from figure 8. Figure 9 indicates that the antenna tension increased with increasing antenna angle for antennas of nearly constant length. With increasing angle, the antenna tension increased eight times faster in the 44° to 64° range than in the 0° to 15° range. The slope of the curve for antenna angles greater than 15° indicates that the required antenna strength increases rapidly as the antenna angle is increased beyond 15°. The investigation presented in reference 2 also recommends a limiting antenna angle of 15°. The variation of antenna tension with antenna length at a constant antenna angle of 15° is presented in figure 10. The data were obtained from figure 8 and indicate that the tension increases nearly linearly with antenna length. The maximum-ten- sion measured for each of the seven experimental antennas during the four flight operations is given in table II.
Conclusions
From an analysis of the tension occurring in aircraft antennas during flights in regions of aircraft icing made for antennae with angles to the thrust axis of the airplane of 0°, 8°, 15°, 44°, and 64° and lengths from 15 to 43 feet, the following results were obtained:
1. The tension in the 440 and 640 antennas increased considerably with distance flown In the icing region, whereas the tension for antenna angles of 15° and-less did not increase appreciably with distance flown in the icing condition.
2. The rate of change of antenna tension with antenna angle in the 0° to 15° range was one-eighth the rate of change of antenna tension with antenna angle In the 44° to 64° range. The slope of the curves of tension as a function of antenna angle begins to change appreciably above 15°, which indicates that the required strength of antennas will increase rapidly if the antenna angle is increased beyond 15°.
3. Antenna tension varied approximately linearly with antenna length.
4. The maximum recorded tension for the 0° to 15° antennas was 68 pounds. The maximum tension for the 44° and 64° antennas was 274 and 438 pounds, respectively.
Citations
NACA-RM-E7H26a is cited by three publications, per scholar.google.com.
For more on the Multirotating cylinders instrument, see Icing on Cylinders, and Meteorological Instruments.
Also see Component Ice Protection.
Reference 1 is:
- Vonnegut, B., Cunningham, H. M., and Katz, B. E.: Instruments for Measuring Atmospheric Factors Related to Ice Formation on Airplanes. M.I.T., De-Icing Res. Lab., April 1946.
Reference 2 is:
- Haller, George.L.: Icing of Aircraft Antenna Wires. Jour. Aero. Sci., vol. 6, no. 1, Nov. 1938, pp. 27-28.
Notes
-
Kepple, W. L.: Determination of Aircraft Antenna Loads Produced by Natural Icing Conditions. NACA-RM-E7H26a, 1948. ntrs.nasa.gov ↩