"complete knowledge of the physical conditions under which supercooled clouds may exist, and the factors that cause a supercooled cloud to transform to an ice-crystal cloud is necessary"
"A Photographic Study of Freezing of Water Droplets Falling Freely in Air" 1
Abstract
SUMMARY
A photographic technique for investigating water droplets of diameter less than 200 microns falling freely in air at temperatures between 0° C and -50° C has been devised and used to determine:
(1) The shape of frozen droplets
(2) The occurrence of collisions of partly frozen or of frozen and liquid droplets
(3) The statistics on the freezing temperatures of individual free-falling dropletsA considerable number of droplets were found to have a non-spherical shape after freezing because of various protuberances and frost growth, and droplet aggregates formed by collision. The observed frequency of collision of partly frozen droplets showed good order of magnitude agreement with the frequency computed from theoretical collection efficiencies. The freezing temperature statistics indicated a general similarity of the data to those obtained for droplets frozen on a metallic surface in previous experiments.
Discussion
APPARATUS
A schematic drawing of the apparatus for observing the presence of frozen droplets among free-falling droplets is shown in figure 1. The entire apparatus, with the exception of the temperature recording device, was housed in a large cold chamber (inside dimensions approximately 10 ft long, 7 ft wide, and 10 ft high). A photograph of the apparatus in place in the large cold chamber is shown in figure 2. The apparatus consisted of a heated spray chamber from which droplets settled into a cooled 4- by 4-inch vertical duct. The cooled droplets were photographed with a cmera and spark source as they passed windows at the bottom of the duct after a 4-foot fall. Provision was made for pumping air out through one end of the spray chamber, so that an upward flow of cold air from the cold chamber could be imposed in the vertical duct.
The spray chamber was kept at temperatures above freezing by a copper steam pipe soldered to the walls of the chamber. Similarly, in order to prevent the water pipes from freezing, the steam pipes were conducted to and from the spray chamber in contact with the water lines. The heated portions of the apparatus were insulated with felt to minimize heat losses. Both the spray chamber and vertical duct were made from Inconel metal to avoid corrosion.
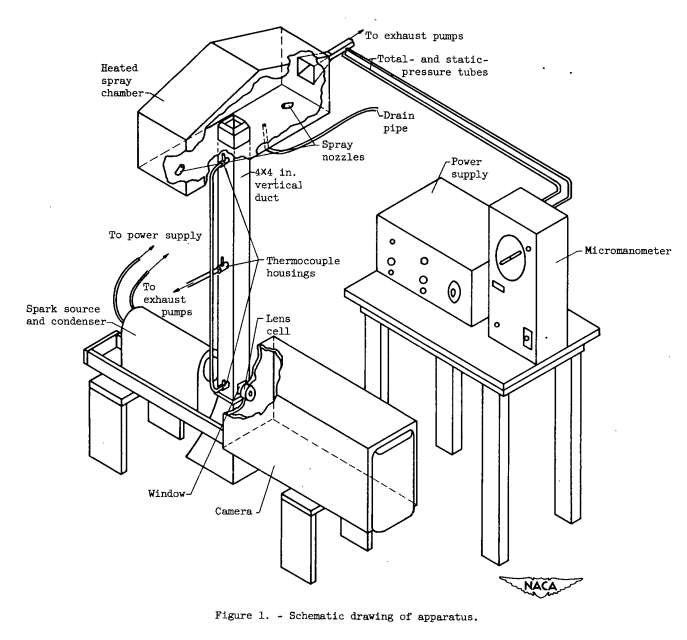
Thermocouples were installed in the spray nozzles for measuring the water temperature. The air temperature in the cold vertical duct was measured at three vertical positions (top, center, and camera level) by pumping air from the duct past thermocouples housed in 3/4-inch diameter tubes attached to a wall of the duct. Glass-wool filters prevented stray droplets from striking the thermocouples. The mass-flow rate of the air pumped from the duct was obtained from the area of the thermocouple-housing tube and the local static pressure in the housing tube measured by a micromanometer. Low mass-flow rates were used in order not to disturb appreciably the air in the duct. The temperatures were recorded on a strip-chart self-balancing potentiometer placed outside the large cold chamber.
The lens of the camera used to photograph the cooled droplets was similar to those used in motion-picture cameras and had a focal ratio of f/2.8 and a focal length of 2 inches. The depth of field was approximately 0.4 millimeter and the volume of field was 0.036 cubic centimeter. The image distance was approximately 44 inches and the magnification was 22X. The depth of field and the magnification were measured by taking photographs of a group of fine quartz fibers placed successively at greater distances from the face of the camera lens. The accuracy of the diameter measurements varies from ±5 percent at 100 microns to ±10 percent at 10 microns. Bright field illumination was furnished by a spark source located on the opposite side of the vertical duct from the camera. The spark source and its power supply are described in references 8 and 9. The spark duration was approximately 2 microseconds, which was a sufficiently short exposure time to yield sharp droplet images.
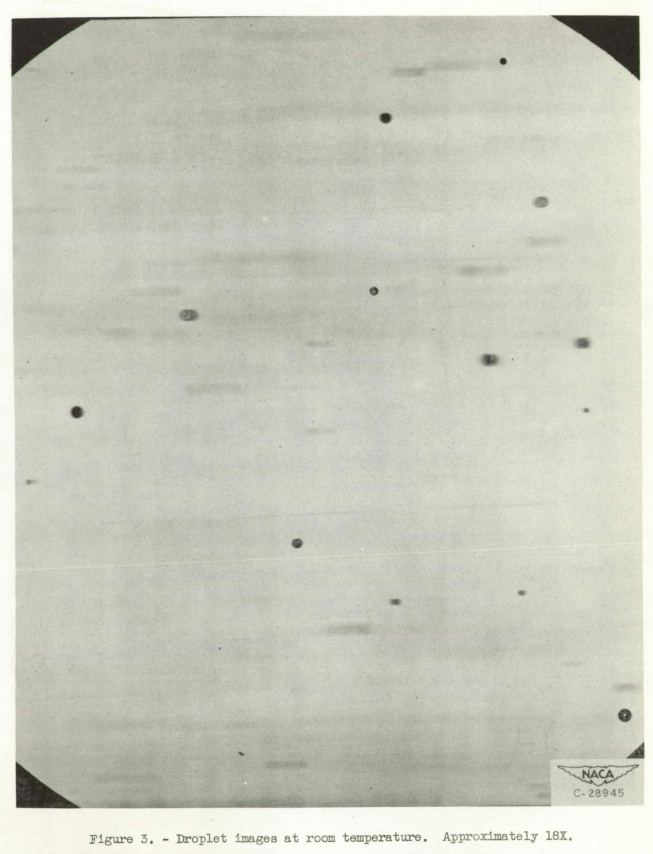
Droplet photographs were taken with fast orthochromatic 8- by 10- inch film. Long development time (10 min) was found to be necessary in order to give sufficient contrast. The images of the droplets appeared on the negatives as white areas on a dark background. Many of the droplet images had dark spots in the center, which were images of the spark source formed by the droplets. A positive photograph of the droplets at room temperature taken with this apparatus is shown in figure 3. An upward flow of cold air from the chamber could be imposed in the vertical duct in order to slow the rate of fall of the droplets and thereby to obtain a longer cooling time before the droplets were photographed. The air outlet from the spray chamber narrowed from a 4- by 4-inch cross-sectional area in the duct to 1- by 1-inch. Thus the airflow velocity was increased in the constricted portion of the outlet to a value which could be measured by total and static tubes connected to a micromanometer.
PROCEDURE
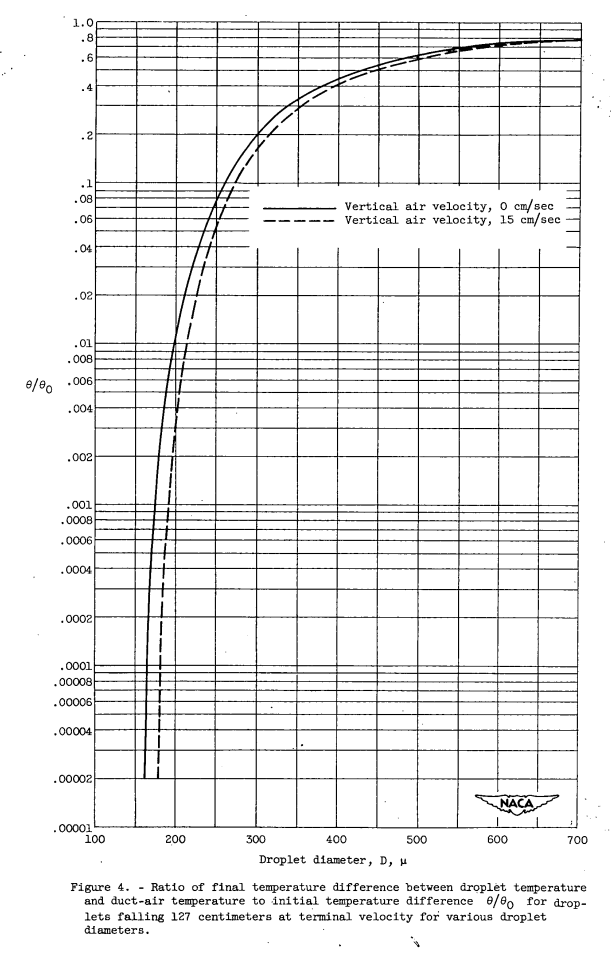
Droplet temperature. - A direct measurement of droplet-temperature was not possible with the apparatus just described, but a computation of how close a droplet of a given size will approach the cold air temperature of the duct in dropping from the warm spray chamber to the camera window level in the vertical duct (127 cm) was possible. The method used for making these computations is described in appendix A. The computed results are summarized in figure 4, which indicates that droplets 200 microns or less in diameter have a temperature negligibly different from air temperature at camera level in the duct. The duct air temperatures measured by the thermocouples at the midpoint and at camera level were usually the same (within 1° C). The temperature measured by the upper thermocouple was somewhat higher (2° to 3° C) because of the proximity of the heated spray chamber.
Detection of frozen droplets. - In addition to determining the temperature of the droplets it was desirable to find a means of differentiating a frozen droplet from a supercooled liquid droplet. A previous investigation showed that a droplet suspended from a thermocouple and observed in bright field illumination generally forms a crude image of the light source, which appears in the positive photographs as a bright spot at the center of the dark circular droplet image. The freezing of a supercooled droplet thus suspended was detected by the disappearance or marked decrease in intensity of the bright spot at the center of the droplet image in an investigation in 1948 by John C. Johnson at Massachusetts Institute of Technology. Investigations at the NACA Lewis laboratory substantiate this method for use with droplets suspended from a thermocouple. Because similar bright spots occur in the images of free falling droplets photographed with the camera, an attempt was made to use the foregoing criterion for determining when free-falling droplets were frozen.
An examination of the droplet images on the photographic negatives disclosed that a considerable portion of the images had a noncircular outline. For reasons, discussed in the Results and Discussion section, these noncircular images were considered to be indicative of frozen droplets. However, considerable numbers of these noncircular images had bright spots at the center. This obvious contradiction coupled with the apparent reliability of the noncircular image criterion eliminated frozen-droplet detection by the bright spot method. Although noncircular droplet images are definite indicators of frozen droplets, an unknown portion of circular droplets may also be frozen. Circular images may be produced by nonspherical (and thus frozen) droplets because of their particular orientation to the camera. Inasmuch as neither the portion of the circular droplet images that are due to unfrozen spherical droplets nor the portion due to droplets that are frozen and remained spherical is known, any absolute estimate of the ratio of frozen to unfrozen droplets in a particular sample is impossible. An appraisal of the ratio of noncircular droplets to the sum of the circular plus noncircular droplets was therefore made as the best means available to detect droplet freezing trends.
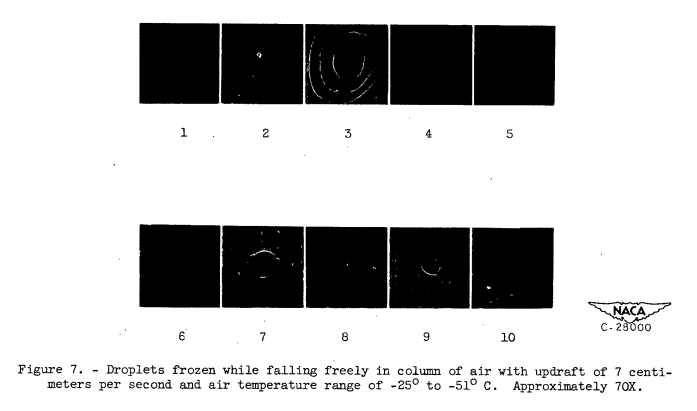
Range of conditions. - Droplet photographs were taken at various temperatures ranging from 0° to -51° C. A group of droplet photographs were also taken at room temperature (approximately 20° C) for comparison with those taken at temperatures below 0° C. For droplets between 46 and 200 microns in diameter, the temperature range below 0° C was completely covered by photographs taken with an updraft velocity in the duct of approximately 7 centimeters per second (terminal velocity for a 46-micron droplet). Because of current interest in the rate of formation of ice crystals in the temperature region of -40° C, the temperature range from -36° to -48.5° C was also covered by droplet photographs taken with no updraft in the duct. For this range, inasmuch as no updraft was used, it was possible to extend the lower limit of the droplet diameter range from 46 to 5 microns.
RESULTS AND DISCUSSION
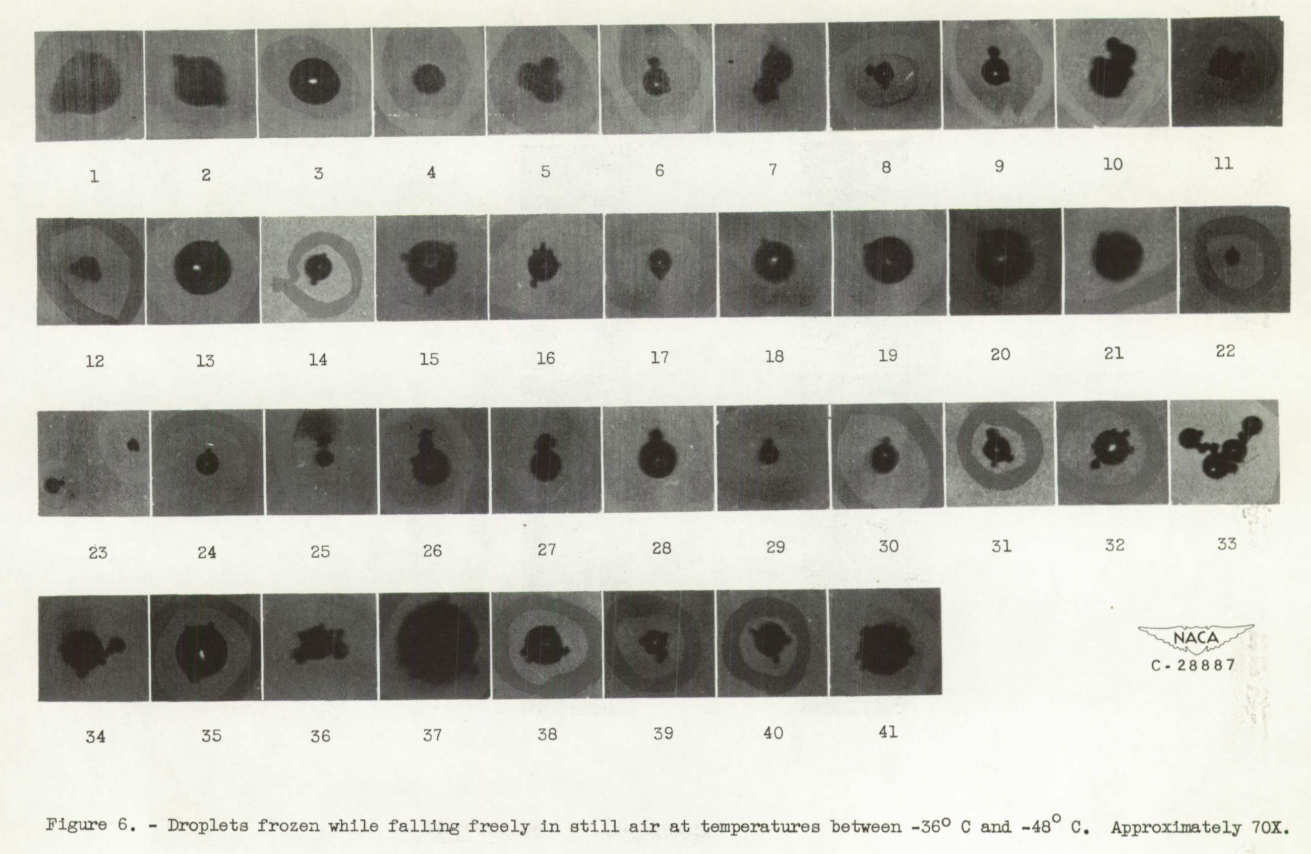
Shape of frozen droplets. - Observations at room temperature indicated unfrozen droplet images were always circular in outline (fig. 3). In photographs of droplets below -20° C, a considerable number of noncircular droplet images was noted (fig. 5). In general, two broad types of noncircular droplet image were observed: type I, images of aggregates of droplets that apparently froze together (for example, droplets 5, 6, and 7 of fig. 6 and 5 of fig. 7); type II, images of irregularly shaped droplets with various types of protuberance (for example, droplets 1, 2, 3, 17, 18, 21, and 24 of fig. 6). Many images were found that were combinations of the two types (such as droplet 33, fig. 6).
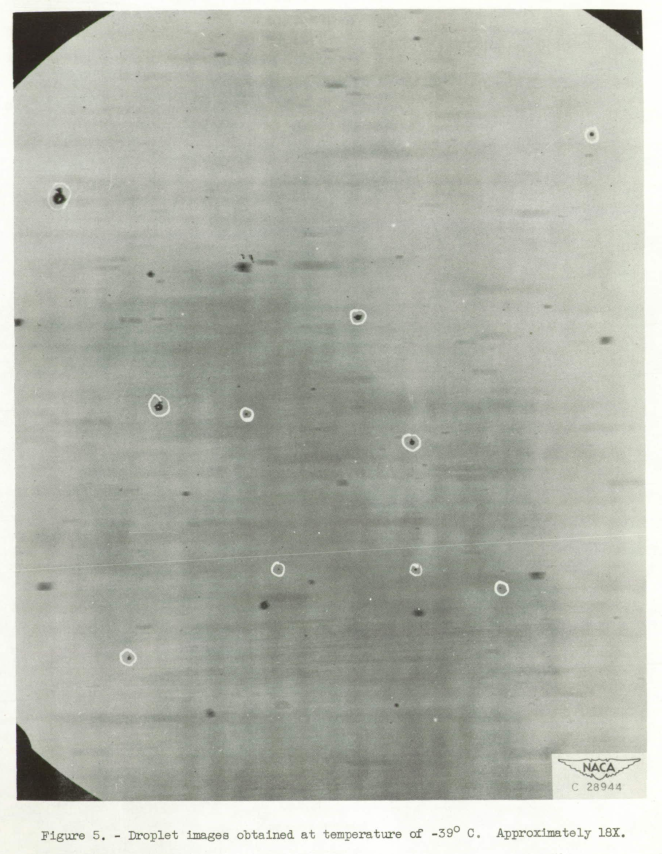
I believe that some drop images are circled with an ink marker.
The quality of the scanned image is poor.
The droplet images have been classified with respect to size and type of image and the results are tabulated in tables I and II. The images that were considered as combinations of the two types were included in the type I group. The sorting of droplet images into type I and type II categories was complicated by the poor definition of the smaller protuberances in the photographs making the boundary line between the two types rather indistinct. The noncircular droplet images were therefore examined with a low powered microscope and only those irregularities which had a definitely circular outline were considered as caused by collision. The remaining protuberances were included in the type II group.
Computations of probabilities of collisions between droplets of different sizes and hence different terminal velocities have been made (appendix B). These computations yielded results consistent with the hypothesis that type I images are the result of collisions between partly frozen droplets. The type II images were probably caused by droplets that were distorted because of internal forces created during freezing and by frost growth on the frozen surface of the droplets.
Freezing temperature statistics. - Whereas the photographic method used in this investigation permitted a gross statistical evaluation of the relation between droplet size and freezing temperature, a detailed study of the dependence of freezing temperature on droplet size by this method was impractical for two reasons:
(1) The relatively small volume of field of view of the camera provided only a small number of droplets in sharp focus per 8- by 10-inch negative.
(2) Inasmuch as each droplet was not observed throughout its entire cooling period, small changes in appearance could not be detected and therefore only those droplets with a definite nonspherical shape could be considered as frozen. Since these were often only a small fraction of the total number of droplets present, it was likely that a sizeable portion of the droplets with a spherical shape may have been frozen.In spite of these limitations several general conclusions can be drawn from the data presented in tables I and II:
(1) At temperatures between 0° and -20° C, no noncircular droplet images were observed, indicating that for droplets smaller than 200 microns in diameter the frequency of occurrence of freezing is very small in this temperature region. (Frequencies too small to be detected in this investigation may, however, be significant in the atmosphere because of the very large number of droplets present in a cloud.)
(2) The ratio of the number of non-circular droplet images to the sum of the number of circular plus noncircular droplet images was larger at all temperatures for the large droplet-size group (150 micrometer) than for the small droplet-size group (82 micrometer) indicating that the droplet freezing temperature tends to increase with increasing droplet size.
(3) The approximate temperature at which irregular droplet images appeared agrees reasonably well with the average temperature of the frequency distribution curves for droplets of corresponding size in reference 3.Thus, the results given in reference 3, for droplets supported on a platinum surface, are at least approximately the same as for free-falling droplets in air.
Conclusions
CONCLUDING REMARKS
The appearance of protuberances and dendritic frost structures on frozen droplets leads to a hypothesis concerning the transformation of supercooled clouds to ice crystals and a mechanism for the production of precipitation. The pointed protuberances which formed at the top of droplets supported by a metallic surface and froze in a water saturated environment were observed in a previous experiment to be the locations of dendritic crystal growth. The tree-like ice structures observed to grow from such points apparently are so fragile that air currents may break them off in fragments, which can become nuclei for additional individual crystalline particles. The pointed protuberances and other irregularities observed on free-falling droplets may also be the location of fragile dendritic frost structures, which in turn may be a source of small ice-crystal nuclei in the form of splinters or fragments that break off. Some evidence of dendritic growth on frozen droplets is apparent in the photographs of free-falling droplets.
As an example, consider the case of warm droplets at the base of a cumulus cloud which are being carried upward by convection currents. As the air rises and cools, the droplets are eventually supercooled. If the droplets are carried high enough, the droplet temperatures are lowered sufficiently for some of the larger droplets to become frozen. These droplets may then be the source of numerous small ice-crystal splinters. These ice splinters can then grow rapidly by reverse sublimation and in turn break up into additional ice splinters, which cause further crystallization of the cloud and eventual precipitation.
The results obtained with the apparatus described in this report can only be considered as preliminary because of the serious difficulty of separating the effects caused by collisions from those inherent in the freezing process itself. However, the results obtained do yield significant, if not conclusive, information concerning the shape of droplets frozen in air, which in turn throws some light on the nature of transitions from the liquid to the ice phase in clouds. In addition, the results obtained inspire more confidence in the extrapolation of freezing statistics obtained for droplets supported on a platinum surface to droplets suspended or falling freely in air in a natural cloud.
Citations
This publication is cited by three publications, per scholar.google.com.
Related
This is part of the Properties of Water thread.
Notes
-
Dorsch, Robert G., and Levine, Joseph: A Photographic Study of Freezing of Water Droplets Falling Freely in Air. NACA-RM-E51L17, 1952. ntrs.nasa.gov ↩