"a reasonably simple means of obtaining the approximate temperature profile downstream of a heated-air jet"
"A General Correlation of Temperature Profiles Downstream of a Heated-Air Jet Directed Perpendicularly to an Airstream" 1
Abstract
An experimental investigation was conducted to determine the temperature profile downstream of a heated-air jet directed perpendicularly to an air stream. The profiles were determined at several positions downstream of the jet as functions of jet density, jet velocity, free stream density, free-stream velocity, jet temperature, and orifice flow coefficient.
A method is presented which yields a good approximation of the temperature profile in terms of dimensionless parameters of the flow and geometric conditions.
Discussion
INTRODUCTION
The heating of an air stream by means of an air jet directed perpendicularly to the air stream is reported in references 1 and 2. These investigations were conducted to determine the penetration of a jet into the air stream at various downstream positions as a function of the jet and stream-flow conditions and of the size and shape of the orifices from which the jet issued. The practical application of such a heating system requires a knowledge of the temperature profile at any point downstream of the orifice as well as the penetration of the jet into the air stream.
An investigation was therefore conducted in a 2- by 20-inch tunnel at the NACA Lewis laboratory to determine the temperature profile in the plane of a jet at several positions downstream of a jet directed perpendicularly to an air stream. Four heated air jets were investigated for a range of free-stream velocities, jet total temperatures, and jet total pressures.
APPARATUS AND PROCEDURE
The orifices used in the investigation were circular thin-plate orifices with diameters of 0.250, 0.385, 0.500, and 0.625 inch. Each orifice was investigated over a range of pressure ratios (ratio of jet total pressure to outlet static pressure) from 1.20 to 3.70 for jet total temperatures of approximately 200°, 300°, and 400° F at free stream velocities of 160, 275, and 390 feet per second. Air for the jets was obtained by passing high-pressure air through an electric heater and into a plenum chamber, the upper wall of which contained the orifices as shown in figure 1.
The temperature profiles were measured at three positions down stream of the orifice center line by means of thermocouple rakes. A rake consisting of 22 thermocouple probes spaced 0.500 inch apart was permanently mounted at the rearmost position (20.31 in.) downstream of the orifice center line. A moveable rake consisting of 33 thermocouple probes spaced 0.250 inch apart was used to measure the temperature profiles at stations 4.81 and 11.81 inches downstream of the orifice center line.
The tunnel boundary layer was removed by suction upstream of the orifice to minimize tunnel-wall boundary-layer effects. (See fig. 1.)
RESULTS AND DISCUSSION
...
The correlation curve of penetration coefficient as a function of the final parameter is shown in figure 15.
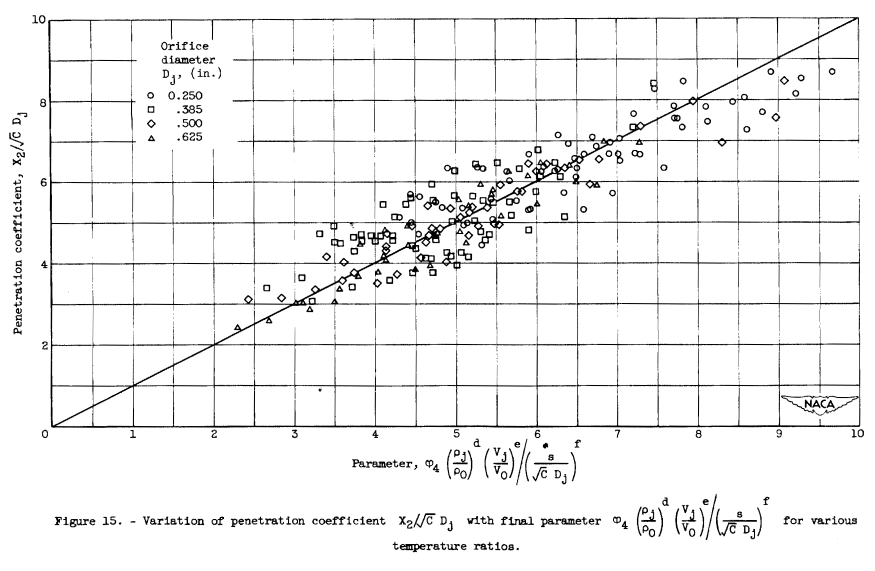
Much of the scatter in figure 16 results from the difficulty in determining X2 from the temperature profiles, particularly for the small-diameter jets at the middle and rearmost rake positions.
In most instances, the actual values of x2 are so small (1 in.) that small difference in reading the temperature and fairing the profiles resulted in errors as high as 20 percent in X2 Several sets of data were taken under the same conditions to determine the reproducibility of the data. Although the profiles were similar, particularly in the upper region (Mu and X1), the values of X2 varied about 10 percent because of the instability of the jet in the lower region. Although these errors in X2 are large percentagewise, the actual error in the over-all profile should not preclude its practical usefulness.
Correlation of Slope Coefficients
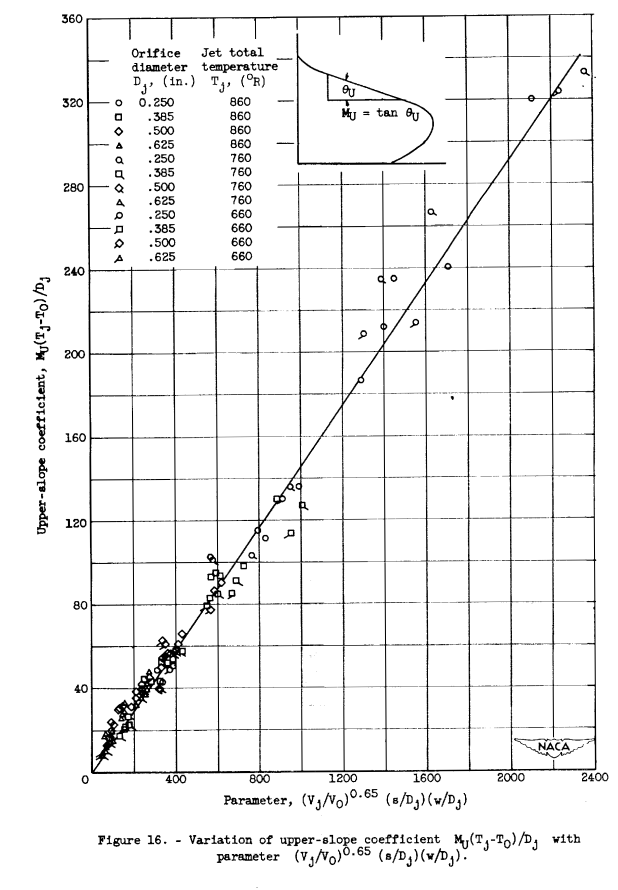
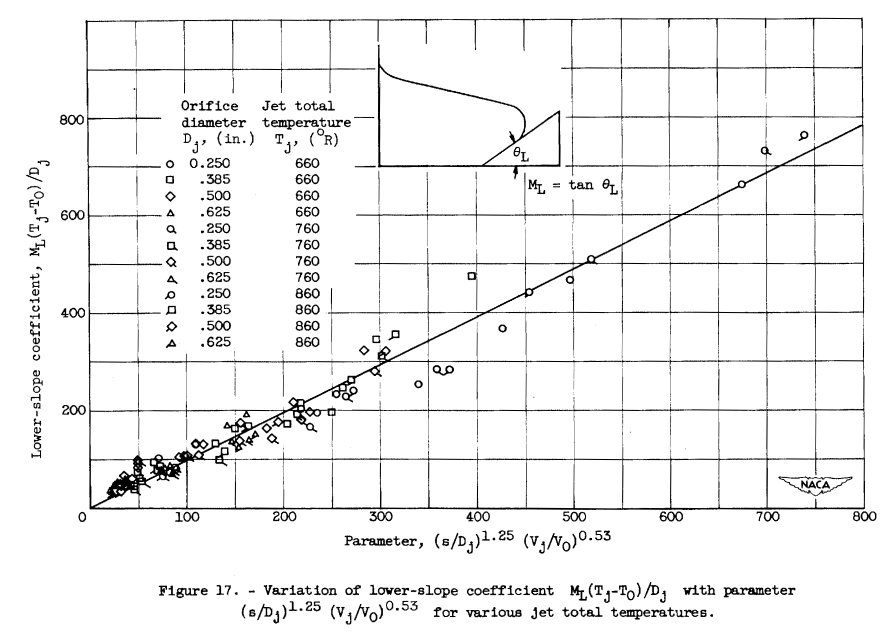
In previous discussion of the profile characteristics, it was noted that the upper and lower slopes of the profiles were independent of jet-pressure ratio for pressure ratios greater than 1.87. The slopes are therefore independent of density ratio, and its effect need not be considered in the analysis. In addition, because the jets are choked, the jet velocity is constant for a given jet total temperature and, hence, the velocity ratio is constant for a particular tunnel velocity. All the data obtained at one rake station for a single jet diameter, jet total temperature, and free-stream velocity may therefore be represented by a single value. Proceeding with the analysis from this point leads to the final correlation parameter (Vj/V0)^0.65 (s/Dj) (w/Dj) for the upper-slope coefficient Mu (Tj-To)/Dj as shown in figure 16. The final correlation parameter for lower slope coefficient Ml (Tj-To)/Dj was found to be (s/Dj)^1.25 (Vj/Vo)^0.53 as shown in figure 17.
Correlation of Maximum Temperature Rise Coefficient
In the previous discussion of profile characteristics, the temperature rise at a given rake station was shown to be nearly independent of jet-pressure ratio for a particular jet diameter, jet temperature, and free-stream velocity. The temperature rise decreases slightly with decreasing pressure ratio (fig. 2(a)). Because the flow coefficient also decreases slightly with decreasing pressure ratio (reference 3), the coefficient ΔTm/C (Tj-To) was investigated and found to be independent of density ratio; it was therefore correlated with the remaining parameters. A further simplification of the analysis resulted when it was found that ΔTm/C (Tj-To) was independent of velocity ratio at a particular rake station and jet temperature. A plot of ΔTm/C (Tj-To) was therefore made as a function of the mixing distance to diameter ratio s/Dj and an independent curve was obtained for each jet diameter. Further analysis of these data showed that if the coefficient ΔTm/C (Tj-To) was multiplied by the width coefficient (w/Dj), a single curve was obtained for all jet temperatures as shown in figure 18.
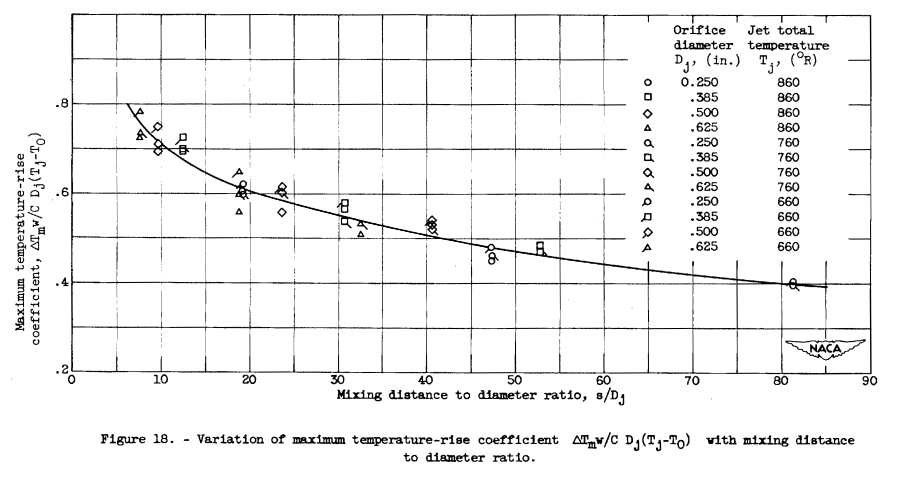
The maximum temperature-rise coefficient ΔTm/C (Tj-To) is therefore a function only of the mixing distance to diameter ratio.
Comparison of Calculated and Experimental Profiles
The correlation of the penetrations, slopes, and maximum temperature rise with the flow and geometric parameters presented in the foregoing discussion provides a means for obtaining an approximation of the temperature profile.
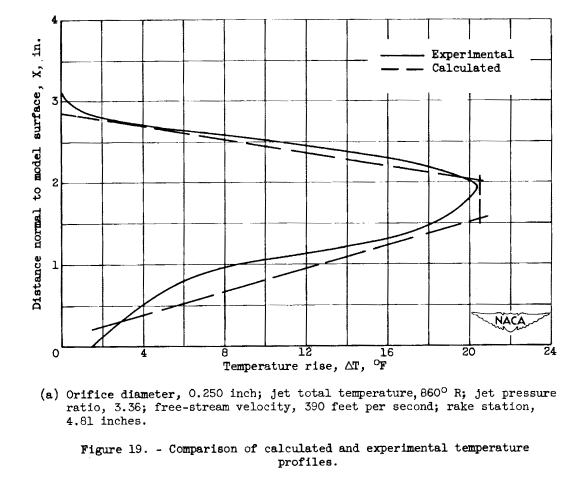
A number of profiles were calculated, based on the experimental conditions, and compared with the actual profiles. Some typical results are shown in figure 19. A study of these figures shows that the penetration X1, the upper slope Mu, and the temperature rise ΔTm are in satisfactory agreement with the experimental profile. The penetration x2 and the lower slope ML show lesser agreement because, as previously mentioned, good reproducibility of these data is difficult to obtain. In general, however, the approximate solution is in good agreement with the experimental data and provides a reasonably simple method for obtaining the temperature profile.

Conclusions
A method that provides a reasonably simple means of obtaining the approximate temperature profile downstream of a heated-air jet directed perpendicularly to an air stream has been presented. The solution is presented in terms of dimensionless parameters of the flow and the geometric conditions.
Citations
NACA-TN-2466 is cited 35 times, per scholar.google.com.
Notes
-
Callaghan, Edmund E., and Ruggeri, Robert S.: A General Correlation of Temperature Profiles Downstream of a Heated-Air Jet Directed Perpendicularly to an Airstream. NACA-TN-2466, 1951. ntrs.nasa.gov ↩